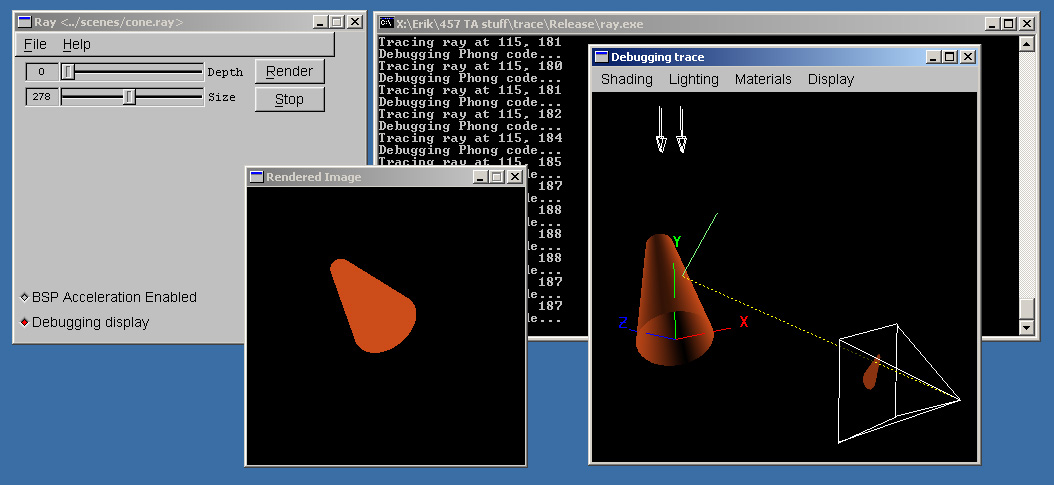
One of the useful tools we are providing with the Trace project is a debugging interface, which you can use to experiment with tracing individual paths through the scene and visualize exactly what is going on with your code. This is meant to be an introduction to the capabilities of this UI.
The first thing you should note is that the UI is already there and ready for you; you don't have to do anything to enable it.
All you have to do is load a scene file and toggle the "Debugging display" check box to open the debugging window.
Every time you call Scene::intersect, the ray and its intersection
is cached so that it can be displayed. As long as you always use this method to
cast rays, they will hence be displayed (including shadow rays, if you use this
method in your shadow-handling code). The only thing you have to do is when you
are creating the ray that will be traced, identify what kind of ray it is (the
options are REFLECTION, REFRACTION, VISIBILITY, and SHADOW; you may or
may not wish to extend this, but remember you'll have to go into
debuggingView.cpp also). The cache is
cleared out at the top-level RayTracer::trace, so that when you
view traced rays in the debugging window, only the ones for a particular pixel
are shown.
I'm not sure how useful this behavior is going to be for photon mapping. Certainly it will help for doing the final gather at the end, but it's less clear how it will help in the initial photon casting step. Intuitively, I think you'll want to do something like this:
Scene::intersect appropriately in the photon tracing portion of the project.You may also want to include a little bit of code to visualize the photon
map in the view as well, perhaps as colored points. You can either provide
accessors to the photon map class if you wish, or perhaps give it it's own
glDraw function. You can call this in the appropriate place in
Scene::glDraw.

This is what you will see when you enable the debugging view with the skeleton code. You will notice a number of features, each of which can be turned on or off using the "Display" menu:
isect class; if you calculate your normals wrong
when you are calculating intersections, they will appear
incorrect in the debugging view as well.ui/glObjects.cpp.Now, as described above, you can easily move in and around the scene using the controls that you should be familiar with from Modeler. In order to get the full use of the debugging window, you should use the Rendered Image window to trace individual rays. Simply clicking on a pixel in the image window will cause the raytracer to trace rays through that pixel to the maximum depth specified by the depth slider. Additional tips:
scene->intersect function.One problem you may encounter is that the camera code for the debugging view uses some very arbitrary heuristics (hey, I was young!) to determine what should be a good view of the scene. This seems to be correct for most reasonable scenes, but there may be scenes where you find that the heuristics fail and the scene itself starts out entirely out of the view frustrum. You should be able to maneuver it back in if this happens.