CMU 15-112: Fundamentals of Programming and Computer Science
Homework 4 (Due Thursday 14-July at 8pm)
- As usual, this homework is solo. You must not collaborate with anyone (besides current course TA's and faculty) in any way. See the syllabus for more details.
- To start:
- Create a folder named 'hw4'
- Download all of these to that folder:
- Edit hw4.py using VSCode
- When you have completed and fully tested hw4, submit hw4.py to Autolab. For this hw, you may submit up to 7 times, but only your last submission counts. (Safety submissions are a good idea if you're working near the deadline!
- There is no autograder for hw4. The TA's will manually grade your last submission sometime soon after the hw deadline.
- Because there is no autograder, you should download your submission and run it to make sure you submitted the properly-formatted file you think you submitted! As usual, we cannot accept late submissions even if you accidentally submit an old or blank file, etc.
- Do not use lists, list indexing, sets, dictionaries, or recursion this week.
Please note that we may grade this (and any future) hw for style!
Homework4 overview:
- drawPattern1 [25 pts]
- drawNiceRobot [35 pts]
- drawFlagOfQatar [40 pts]
- Bonus/Optional [up to 3 bonus pts]
These are bonus/optional. They are fun, interesting problems that are worth very few points. If you attempt these, do them for the fun and the learning, not the points.- drawPattern2 [1 pt]
- drawFancyWheels [2 pt]
Each of the exercises in this assignment will draw a graphics pattern. When you run the starter file, it will create an interactive animation window. In this window you can press a number key to select which pattern you wish to view. Try running and interacting with it before writing any new code! We will explain animations, events, and more in the near future. For now, you are only responsible for writing the graphics functions listed below, each of which are called by the starter file when you press a specific number key, and should draw the correct pattern to the canvas.
Notes:
- If the function takes width and height as arguments, the pattern should fill the canvas, as these refer to the width and height of the canvas.
- These graphics exercises are not autograded. The TA's will manually grade these.
- There are many reasonable ways to solve these exercises!
- drawPattern1(canvas, width, height, points) [25 pts]
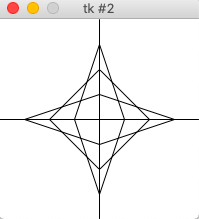
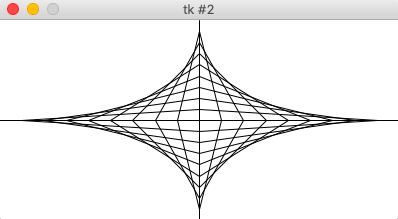
Write the graphics function drawPattern1(canvas, width, height, points), which draws the following diamond pattern on the canvas using only lines. Note thatpointsis the number of points to create along each side.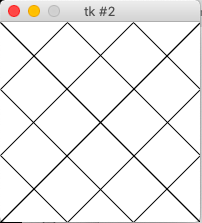
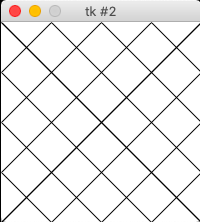
drawPattern1(canvas, 200, 200, 4) drawPattern1(canvas, 200, 200, 5) drawPattern1(canvas, 400, 200, 10) - drawNiceRobot(canvas, width, height) [35 pts]
Write a function drawNiceRobot(canvas, width, height) that draws a nice robot! This is not meant to be very difficult. We just want to see some really cool robots while grading your homework. Your function must make a drawing using cmu_112_graphics that meets the following criteria:- Easily identifiable as a robot
- Includes at least 10 shapes total, including at least one oval, one rectangle, one non-rectangular polygon, and one line
- Uses at least 4 colors
- Resizes with the canvas. (You may assume that the canvas will always resize proportionally, and you may change the starting proportions in the test case if you want to)
- drawFlagOfQatar(canvas, x0, y0, x1, y1) [40 pts]
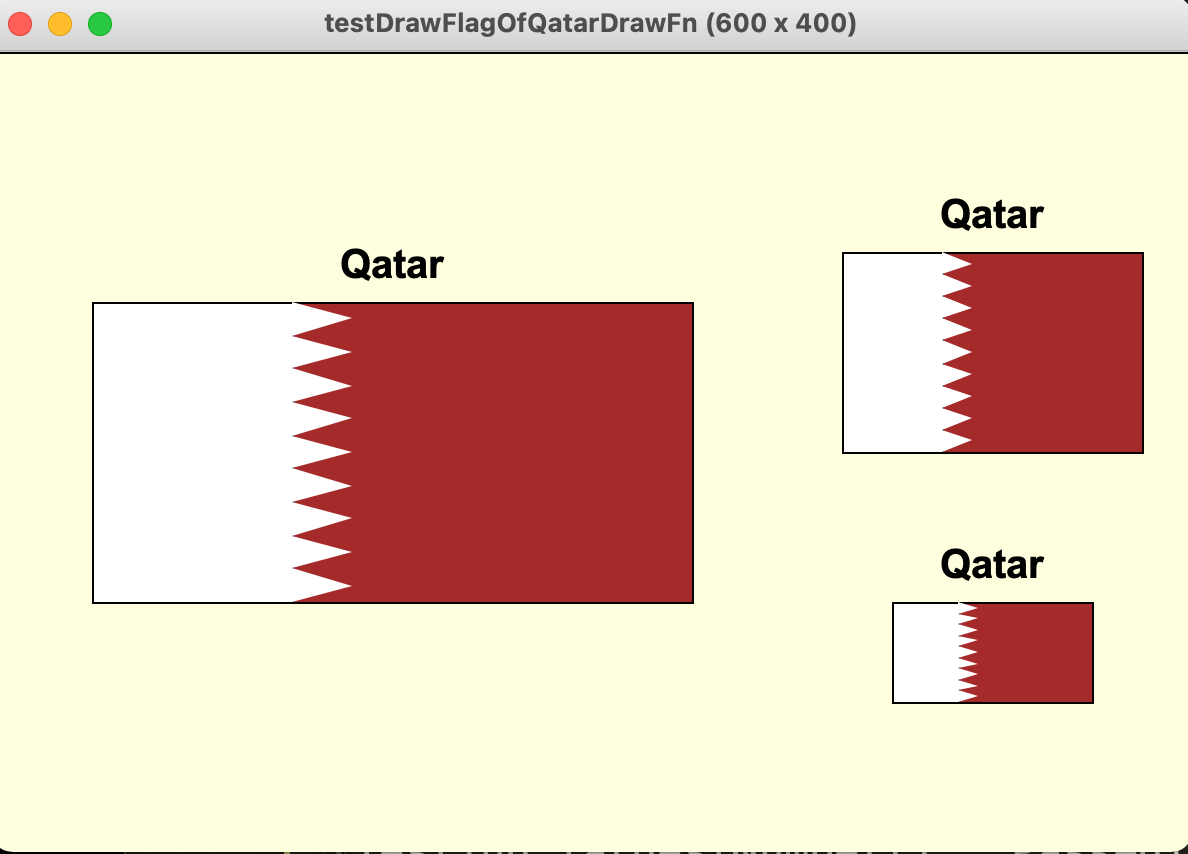
Write the function drawFlagOfQatar(canvas, x0, y0, x1, y1) that takes a canvas and 4 values that describe a region on that canvas, with (x0, y0) at the top-left of the region and (x1, y1) at the bottom-right, and draws a flag of Qatar:

Be sure to follow these guidelines:- Colors do not have to perfectly match! If you want them to match the real flag, get the RGB values here.
- The flag must have a thin black border around it.
- The flag must have the name 'Qatar' in bold, centered just above the top.
- You don't have to be "pixel-perfect" with things like horizontal position of the zig-zag, etc. Just be close-ish.
Hint: You should form the jagged edge by using a loop to draw a series of small triangles. It's good to know about canvas.create_polygon()!
The test function in the starter file calls your drawFlagOfQatar function 3 times. Here is what the resulting drawing should look like, potentially with a different canvas size (again, colors do not have to match perfectly):
Bonus Problems
Bonus problems are entirely optional and worth few points. Do them for the fun and the learning.
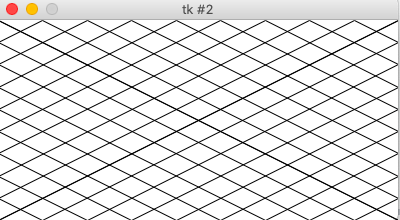
- drawPattern2(canvas, width, height, points) [1 pts]
Write the graphics function drawPattern2(canvas, width, height, points), that draws this pattern using only lines: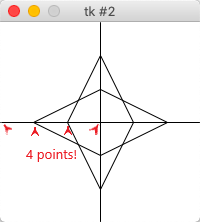
drawPattern2(canvas, 200, 200, 4) drawPattern2(canvas, 200, 200, 5) drawPattern2(canvas, 400, 200, 10)
Notes:pointsis the number of points along each axis in one quadrant (including the center and the endpoint).- Hint: Think of this as an x and y axis. Now, look only at the first (top-right) quadrant. See that as we move down the y axis, we move right across the x axis. We draw a line from each point on the y axis to the corresponding point on the x axis as we go. In this way, the lines start mostly vertical and end mostly horizontal. Think about it! Then do the same basic idea for the other 3 quadrants.
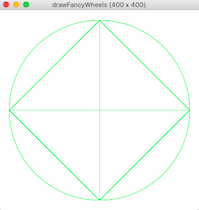
- drawFancyWheels(canvas, width, height, rows, cols) [2 pts]
Write the function drawFancyWheels(canvas, width, height, rows, cols) that draws a rows-by-cols grid of so-called "fancy wheels" according to the rules below. First, though, for some context, here is the result of calling drawFancyWheels(canvas, 900, 600, 4, 6), scaled here to half-size (50%):
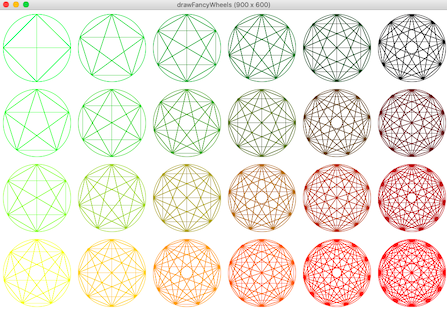
With that, here are the rules to follow. It may help to refer to the picture above as you go:- Think of the drawing as in a grid. Each entry in the grid is a "cell". So the drawing above is a grid with 4 rows, 6 columns, and 24 total cells.
- The width of each cell is the total width of the canvas divided by the number of columns. The height similarly depends on the number of rows.
-
We found it very helpful to use a helper function
for each cell
drawFancyWheel(canvas, cx, cy, r, n, color). Here, (cx, cy) is the center of the wheel, r is its radius, n is the number of points around the wheel, and color is of course its color. - The radius r of each wheel depends on the smaller of the cell width and cell height. Divide this by 2 to convert from diameter to radius. Then, multiply it by 90% so the wheels do not quite entirely fill each cell.
- The number of points n in each wheel depends on the row and the column of the wheel. The top-left wheel should have 4 points, then each wheel on the next diagonal (heading to the up-right) has 1 more point than the wheels on the previous diagonal. Look closely at the picture above to help clarify this.
-
The color of each wheel is made up of red, green, and
blue components, like so:
- The red component is 0 (entirely off) in the top row, and 255 (entirely on) in the bottom row, and varies linearly in between.
- The green component is 255 in the left column, and 0 in the right column, and varies linearly in between.
- The blue component is always 0.
-
A wheel is made up of only two kinds of shapes -- a circle
and some lines.
- Each wheel includes one circle, which is drawn using the radius r of the wheel.
- Each wheel contains n points, but these points are not ever drawn. They are only used as endpoints for the lines. That said, one point is always straight up (at 90 degrees, mathematically), and the rest are evenly distributed around the wheel.
- To draw a wheel, draw the circle and then draw one line for each pair of points around the wheel. Thus, each wheel includes n*(n-1)//2 lines. So if n==4 for example, the wheel include 4*3//2==6 lines.
- As you resize the graphics window, the size of the wheels will adjust, but everything else remains the same -- same number of rows and columns, same colors, and so on.
Finally, to be clear, here is the result of calling drawFancyWheels(canvas, 400, 600, 1, 1) again scaled to 50%: