Additional Information Page for Interspeech 2016 Paper
This webpage contains additional information for our Interspeech 2016 paper, Speech Enhancement In Multiple-Noise Conditions using Deep Neural Networks. pdf
We provide addtional information about the Noise Dataset used and we also provide audio outputs for a few cases.
Authors: Anurag Kumar, Dinei Florencio
Email: alnu AT andrew DOT cmu DOT edu, dinei AT microsoft DOT com
Noise Dataset
The noise dataset used in the paper office-environment noises from 3 sources.
- Noise Collected at Microsoft
- Noises relevant to office environment from [1]
- Rest from freesound.org
A total of 95 noise examples are used. A randomly chosen 70 noise examples are used as Training noise set and the rest 25 are used as testing noise set. All noises are converted to single channel and resampled at 16Khz frequency.
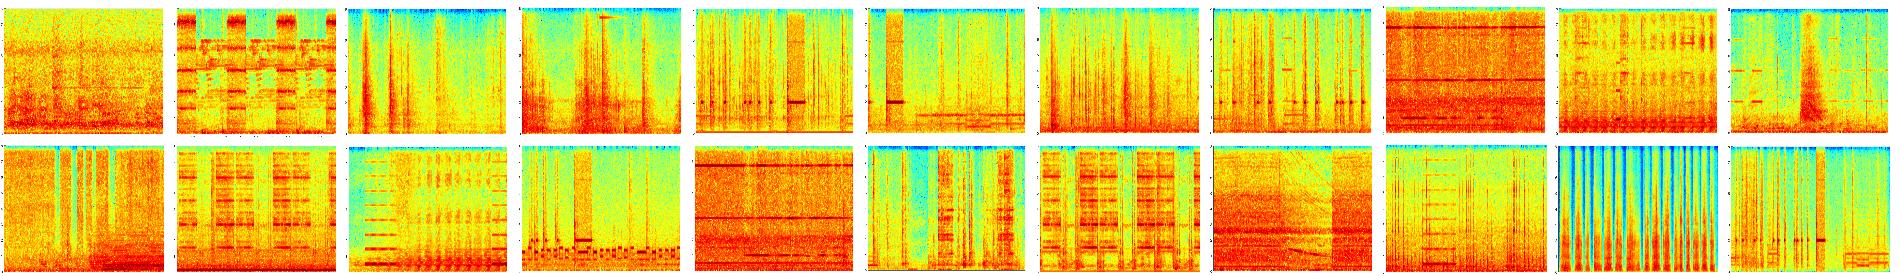
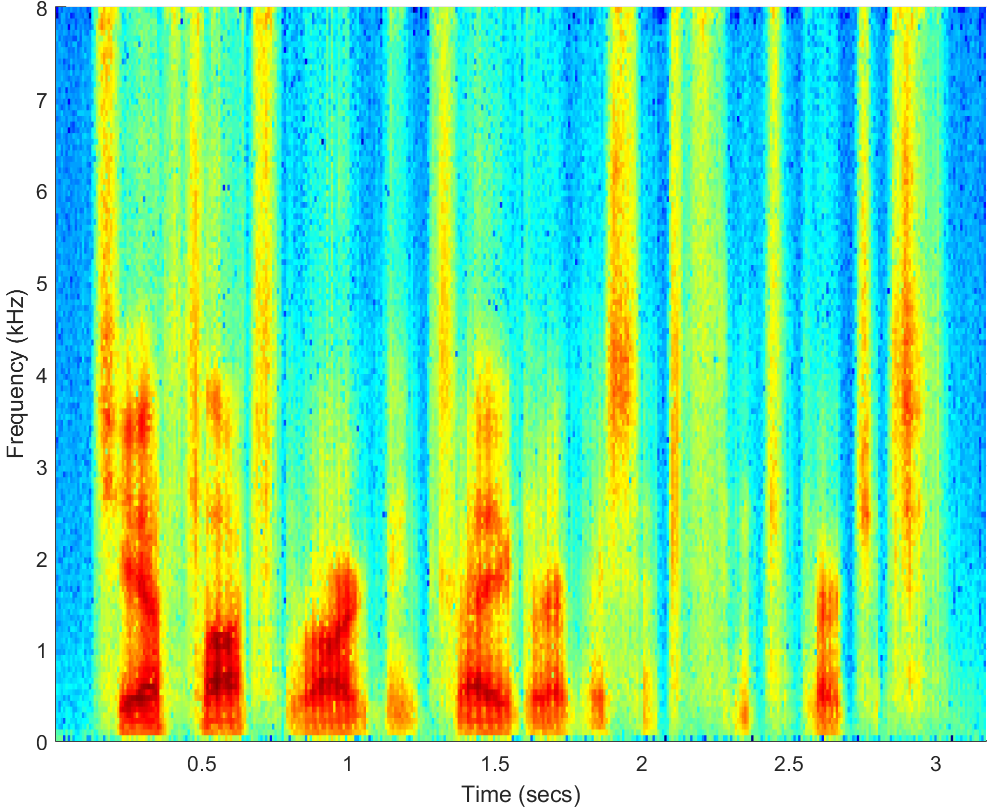
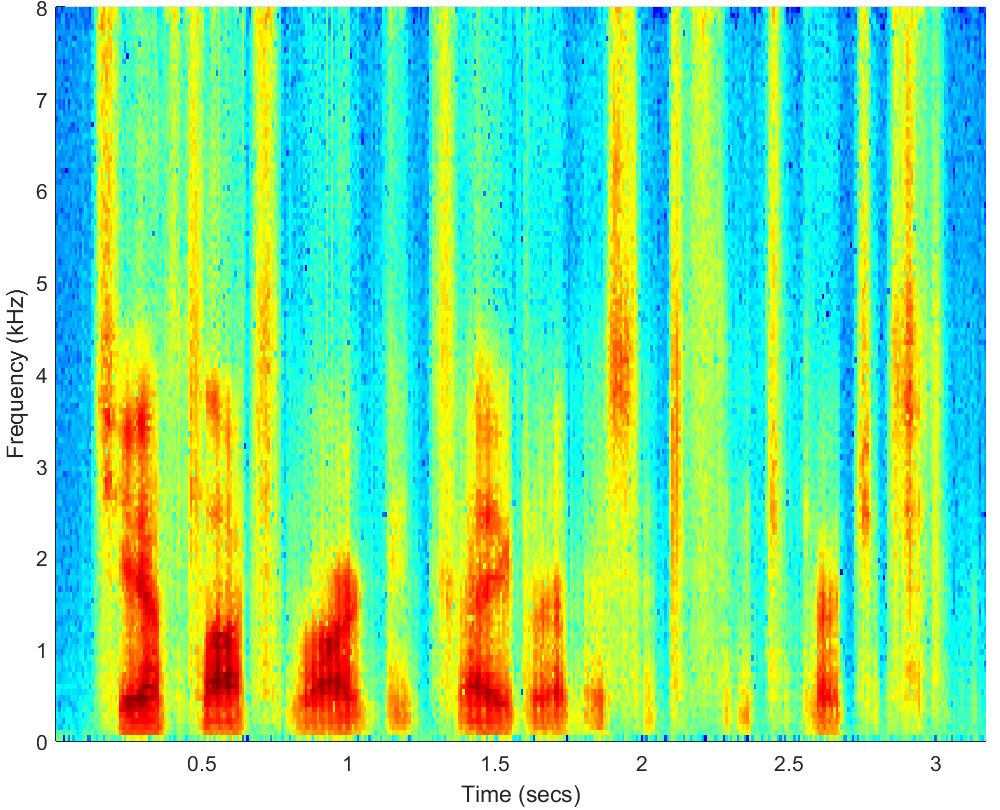
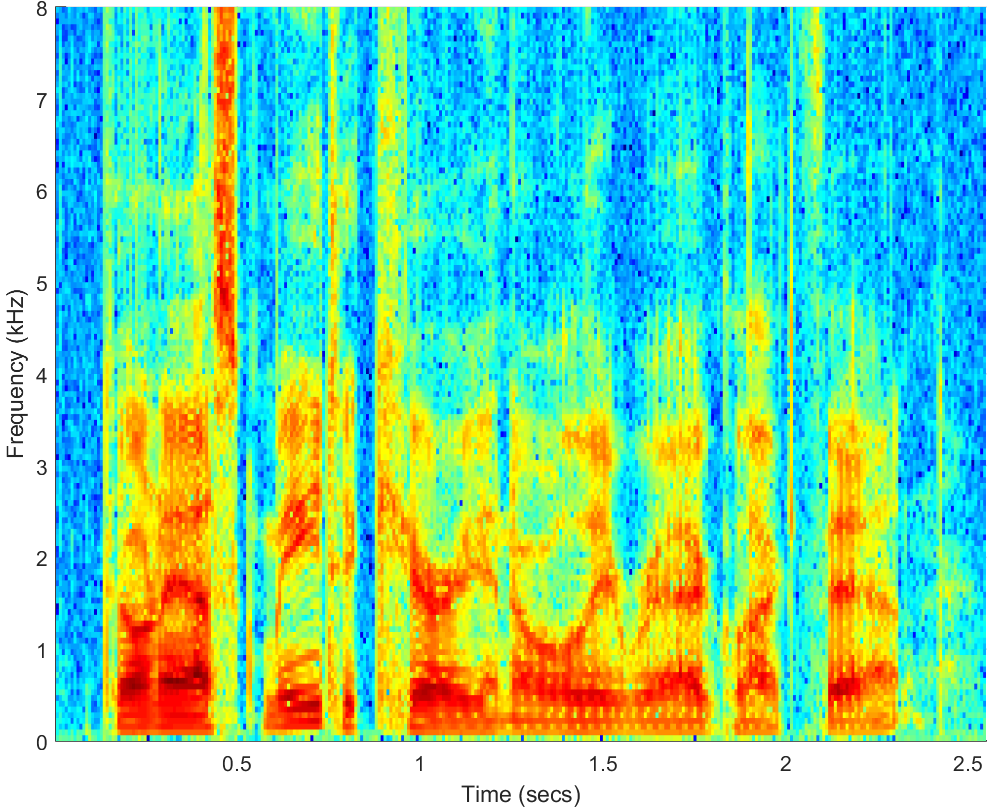
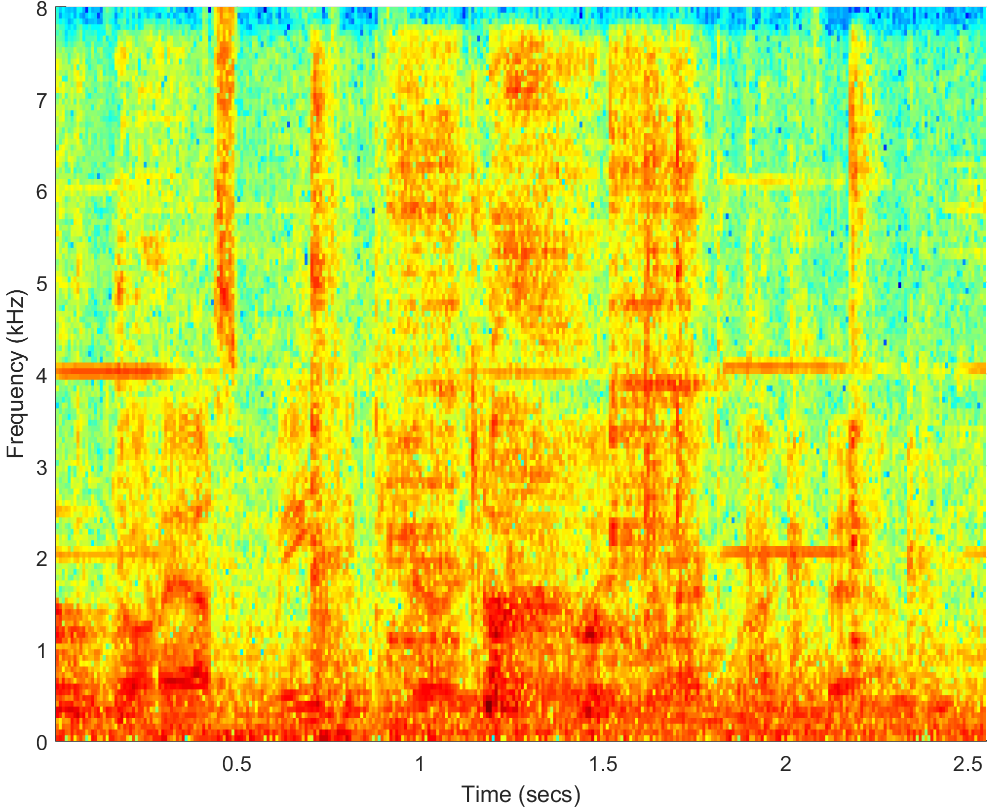
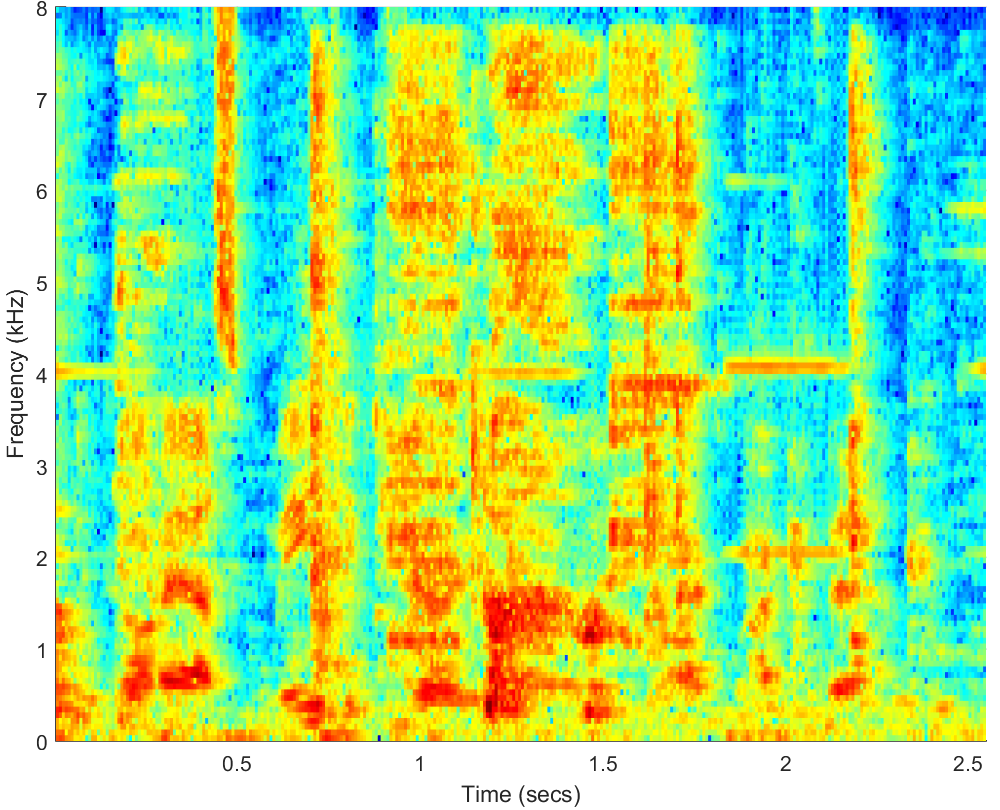
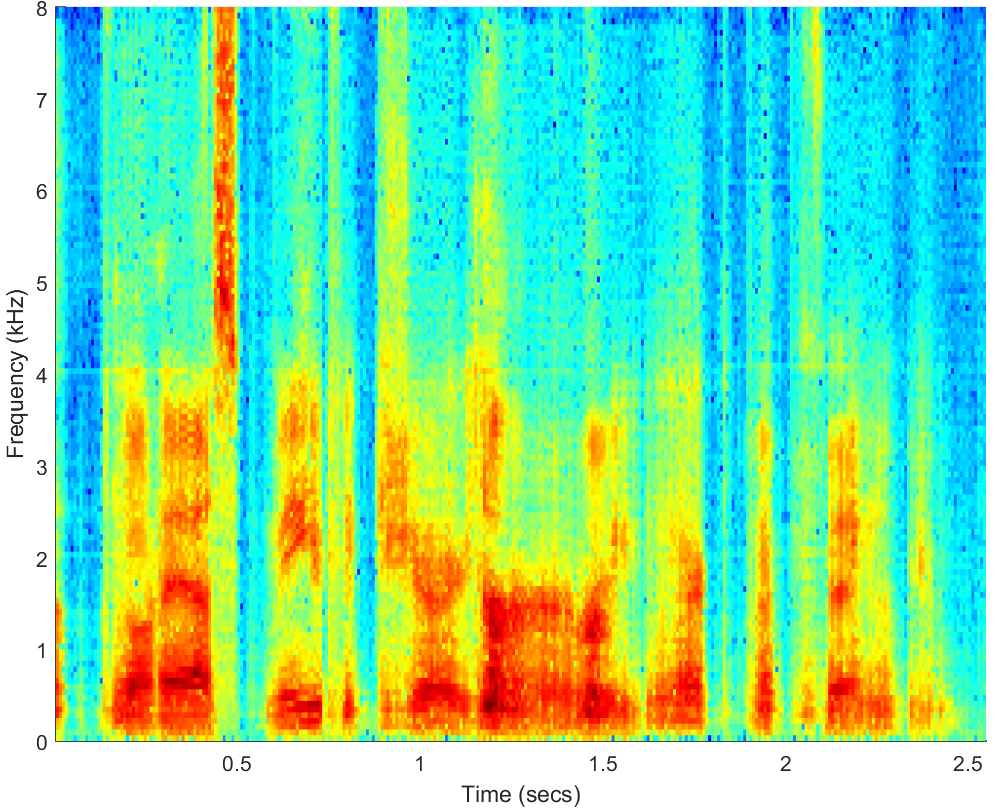
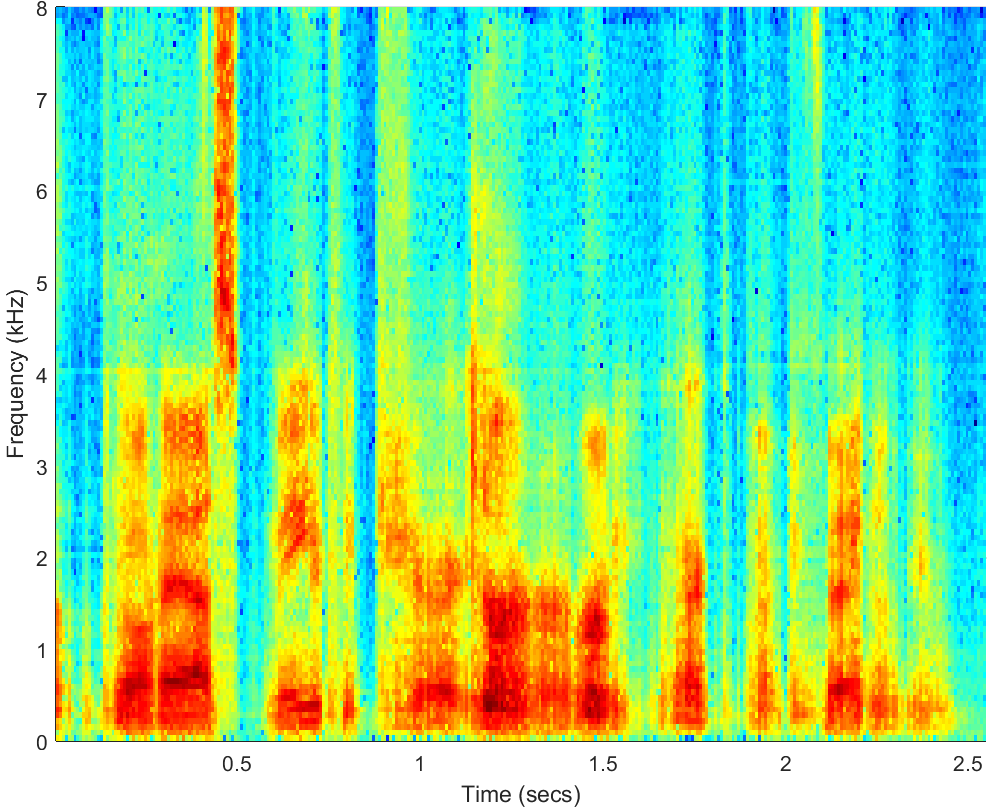
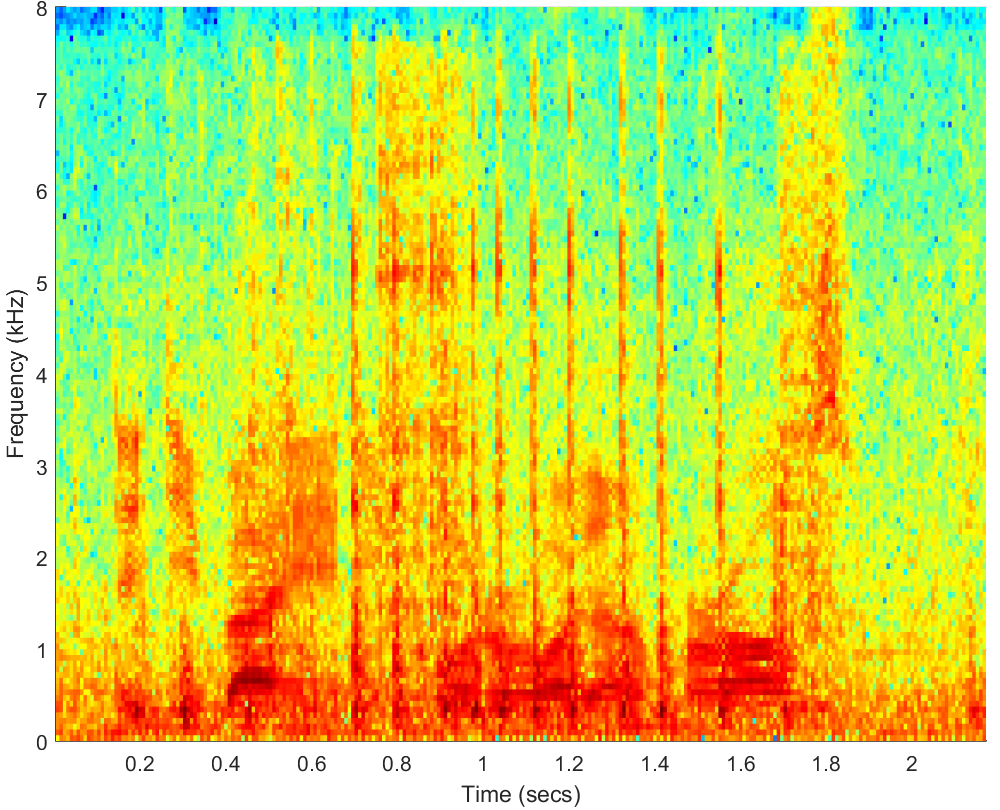
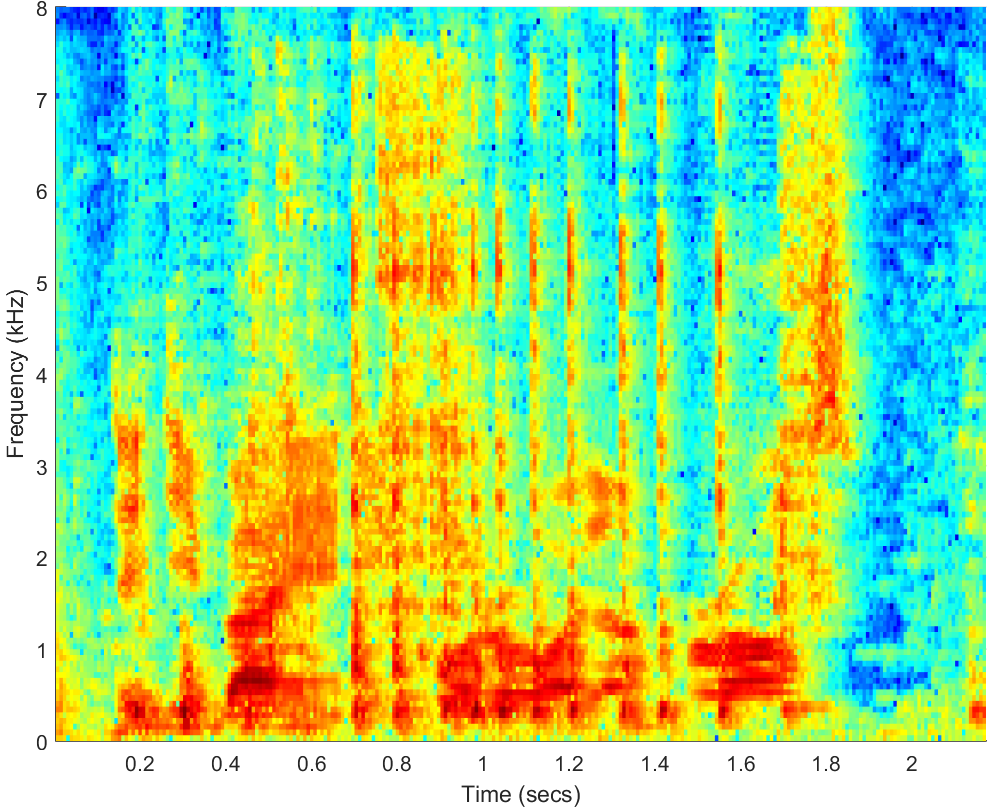
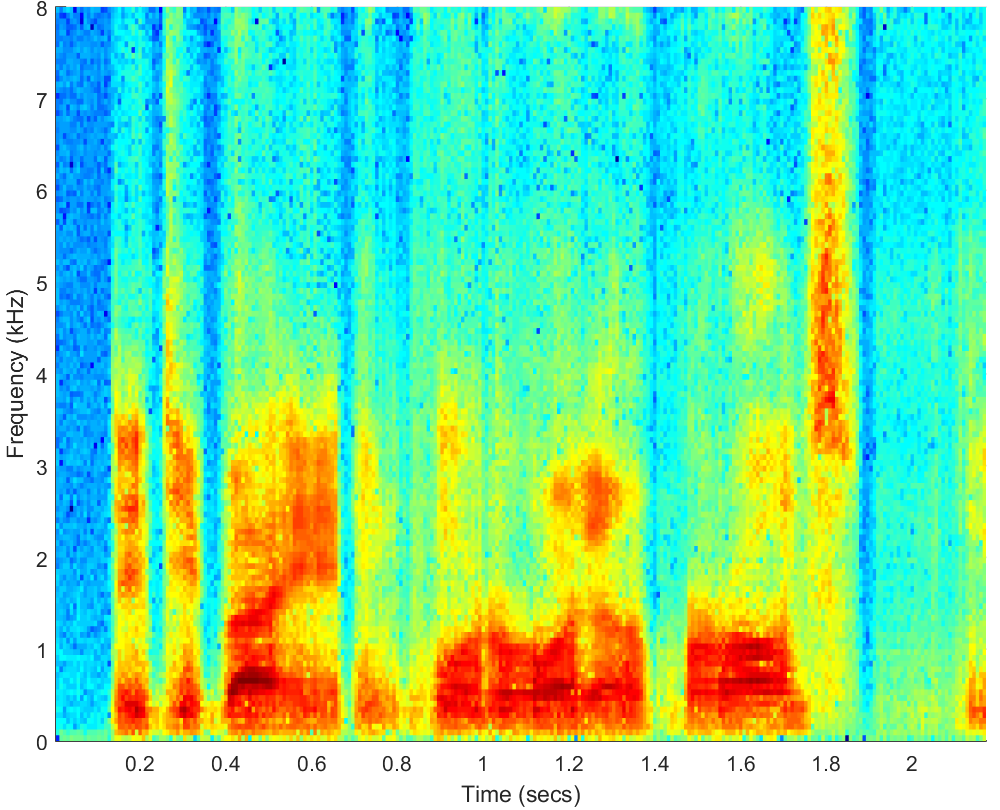
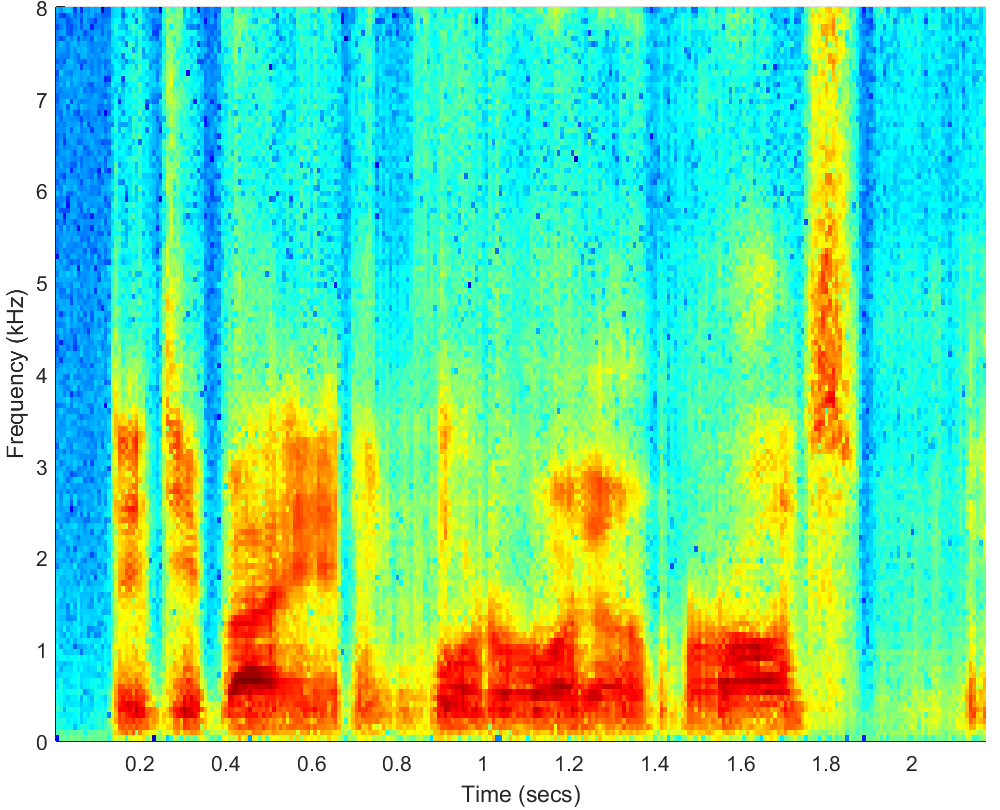
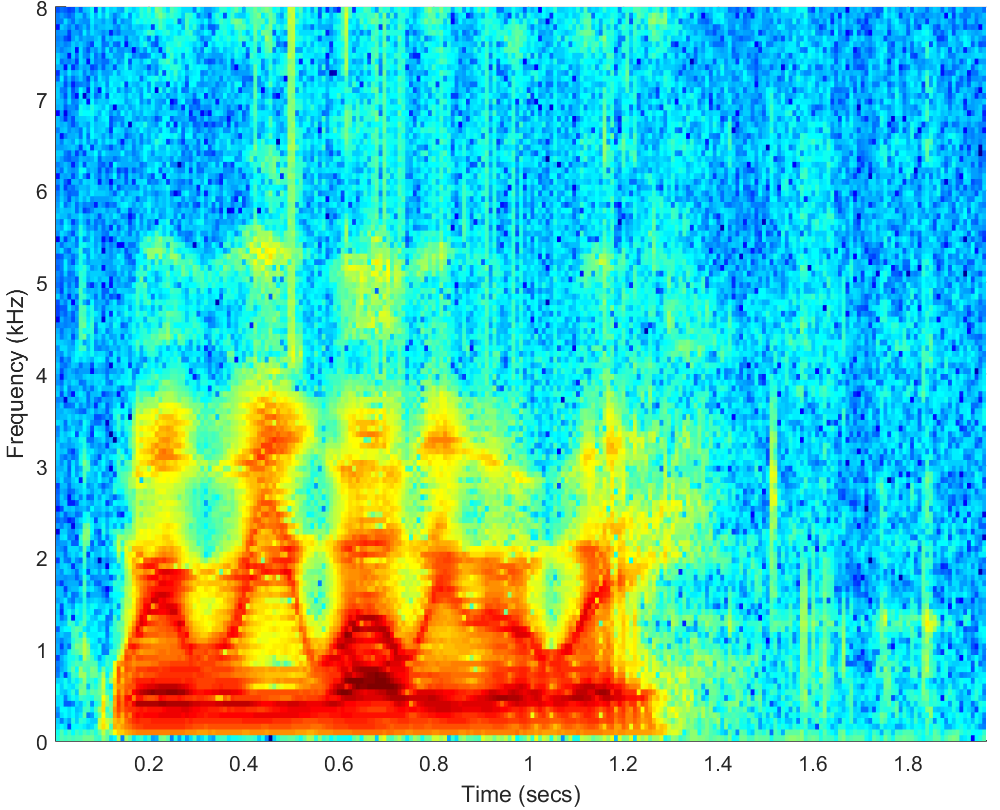
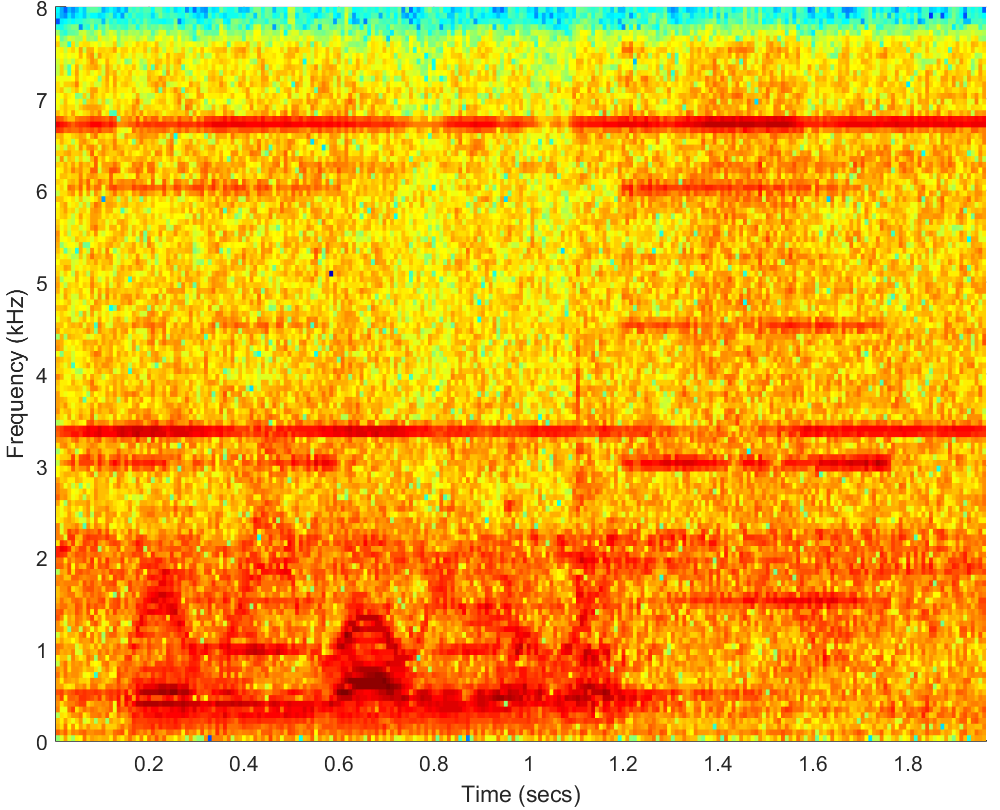
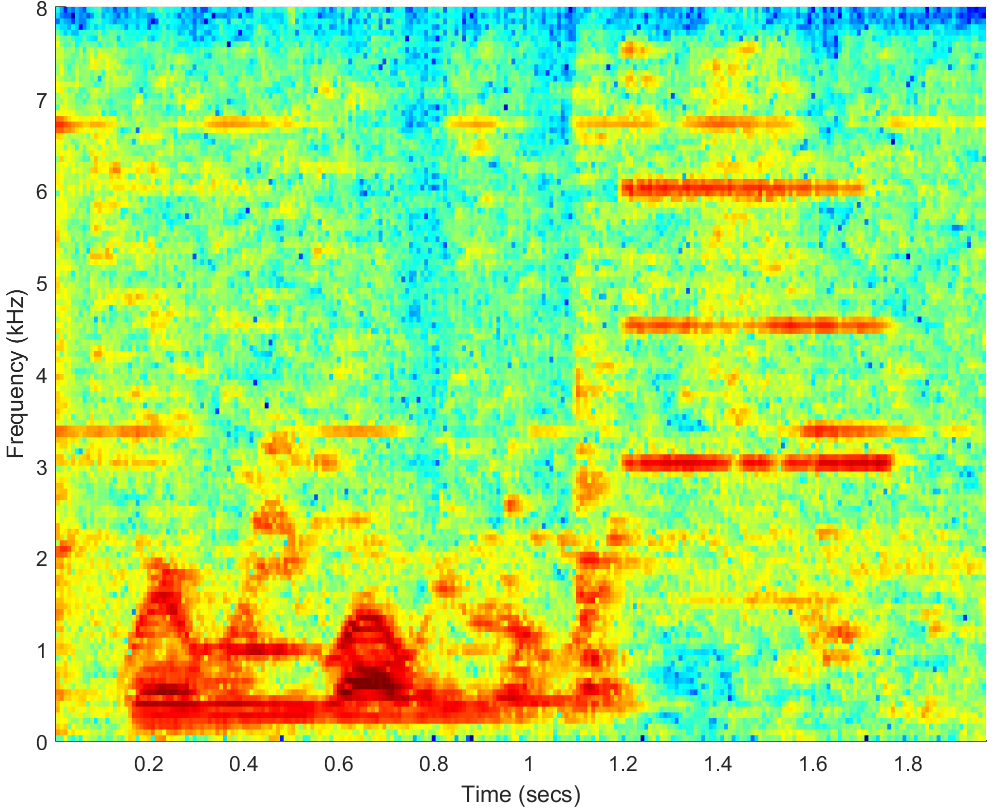
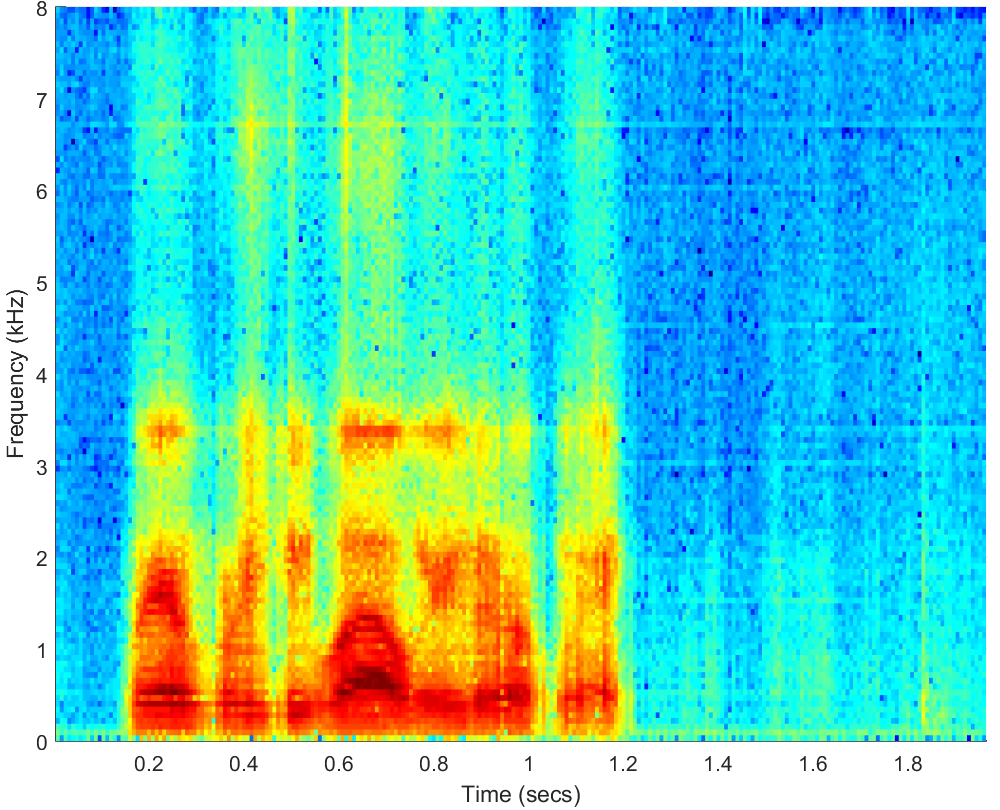
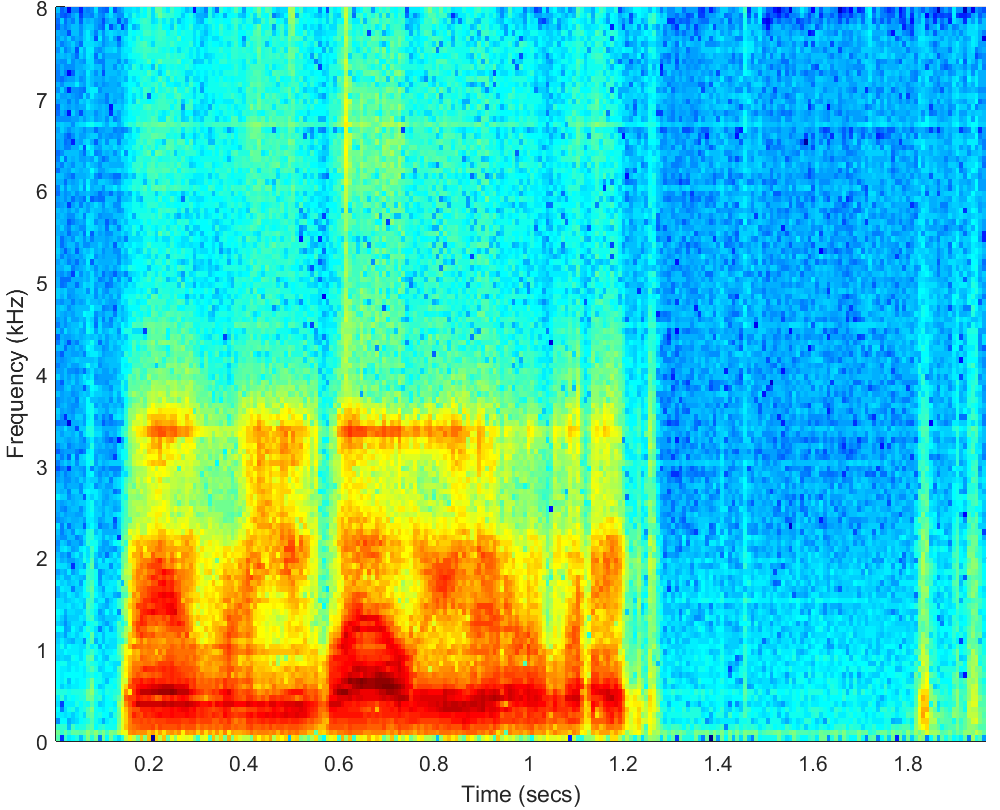
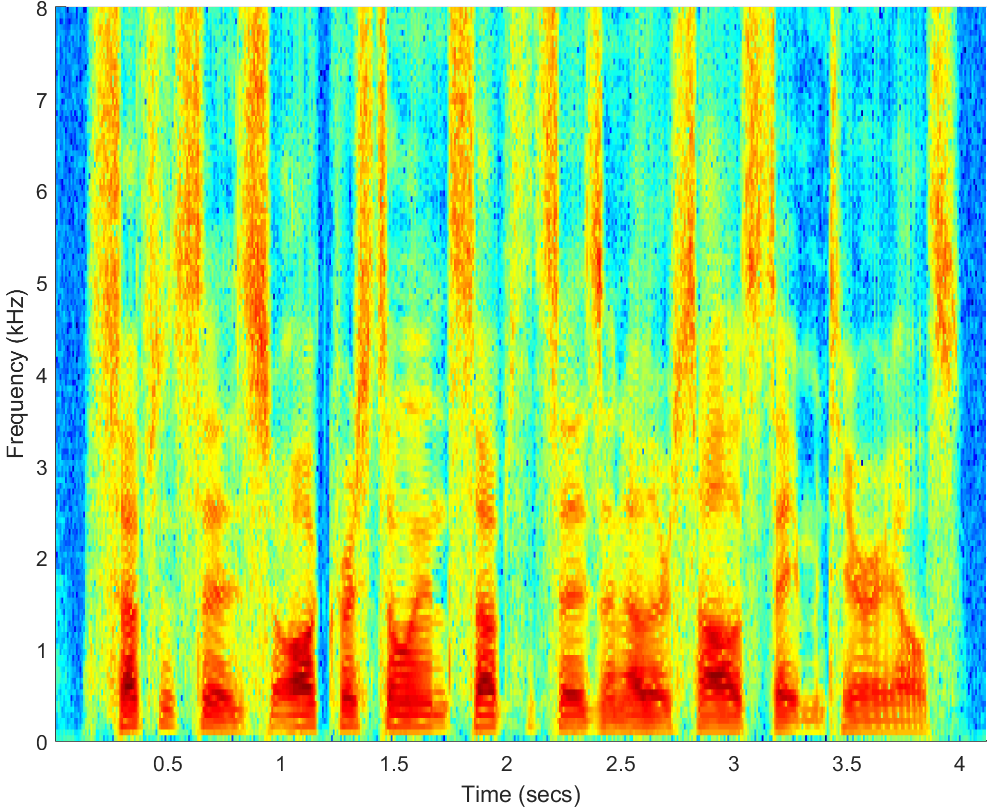
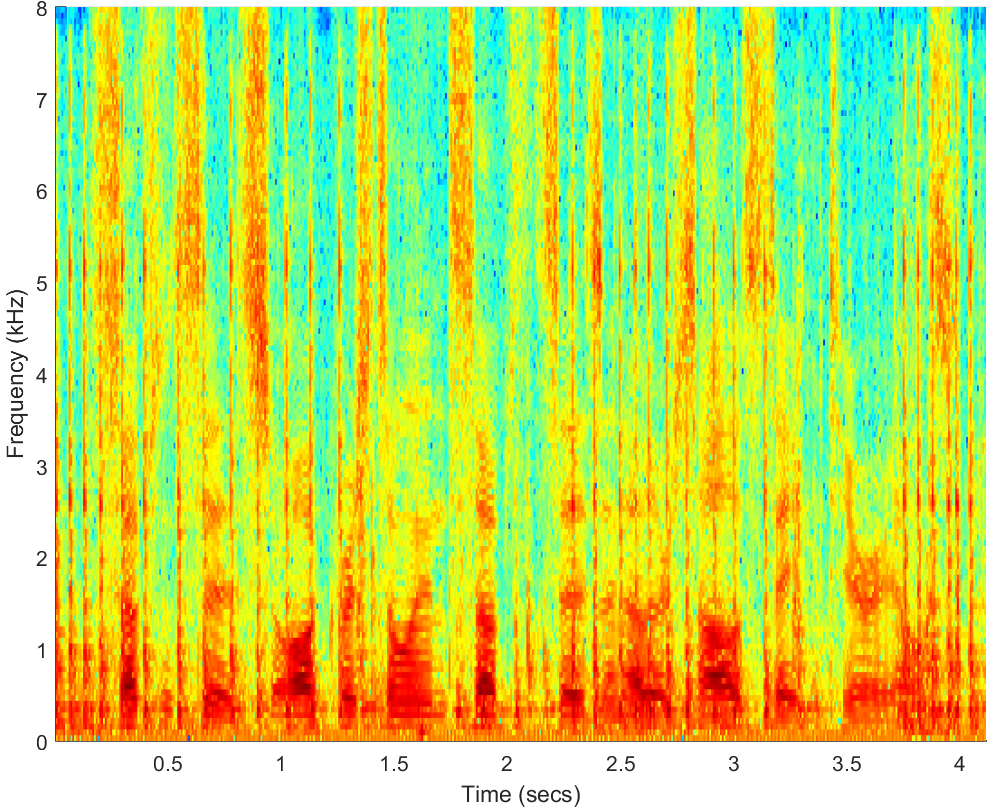
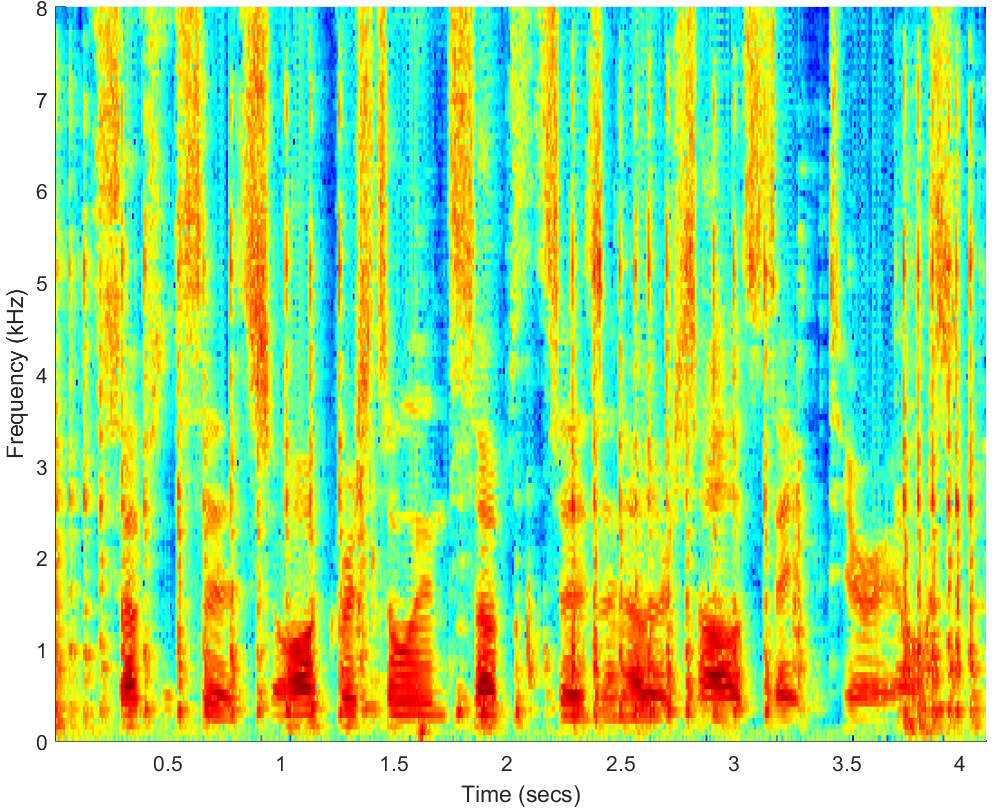
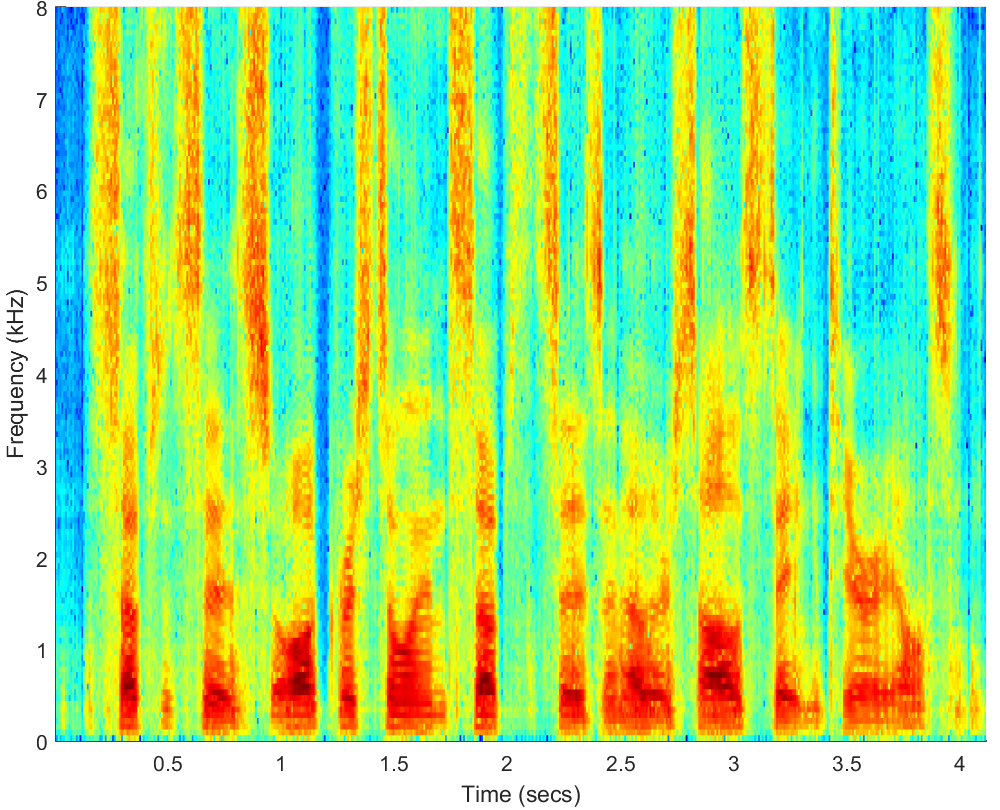
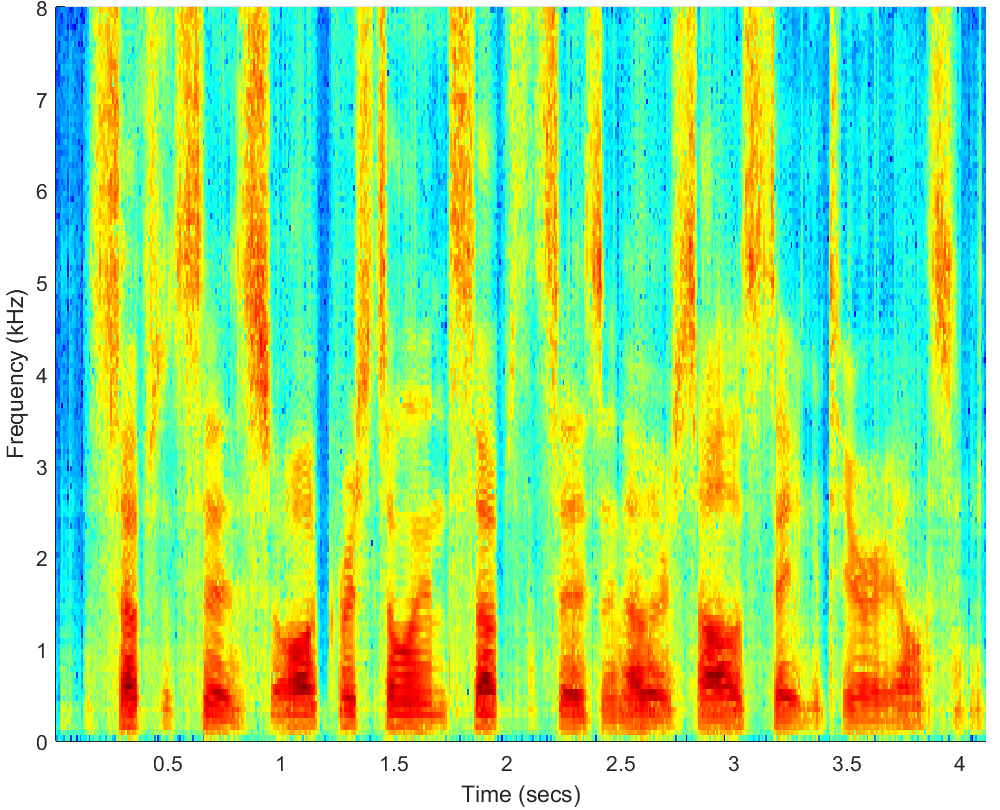
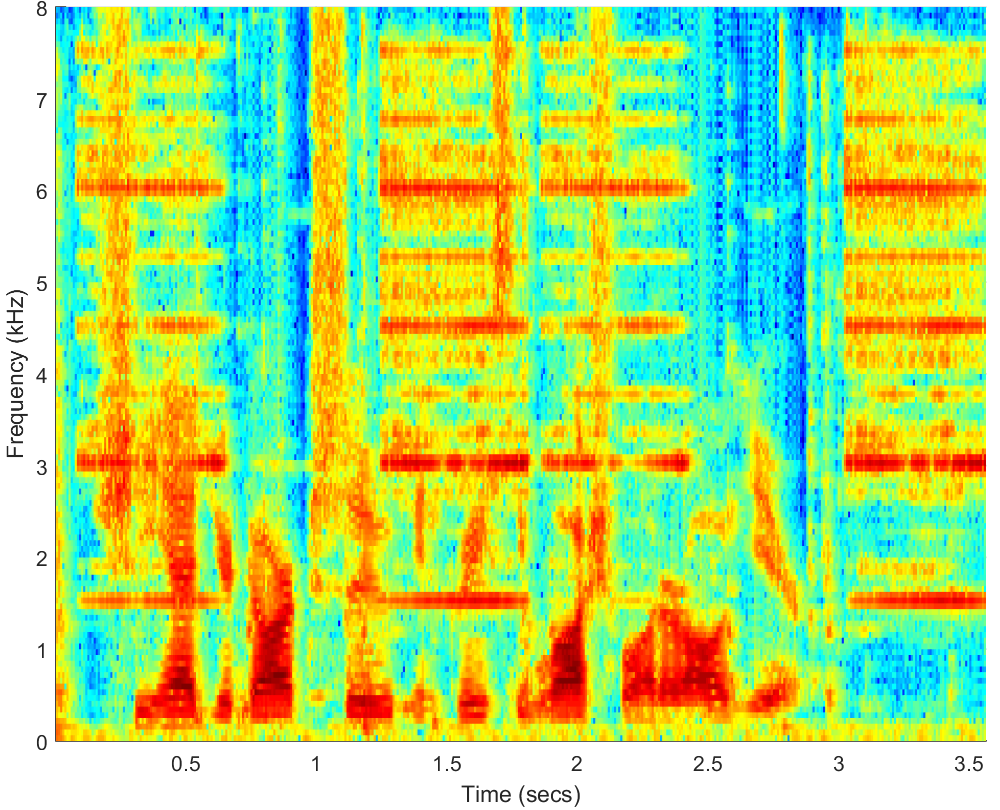
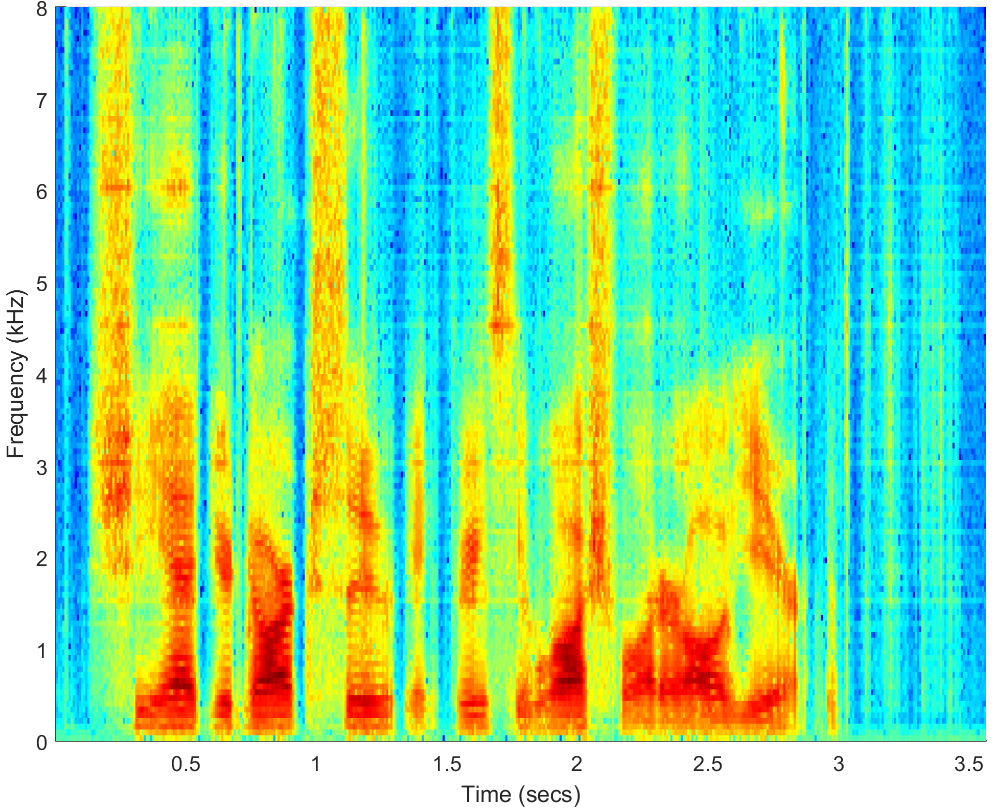
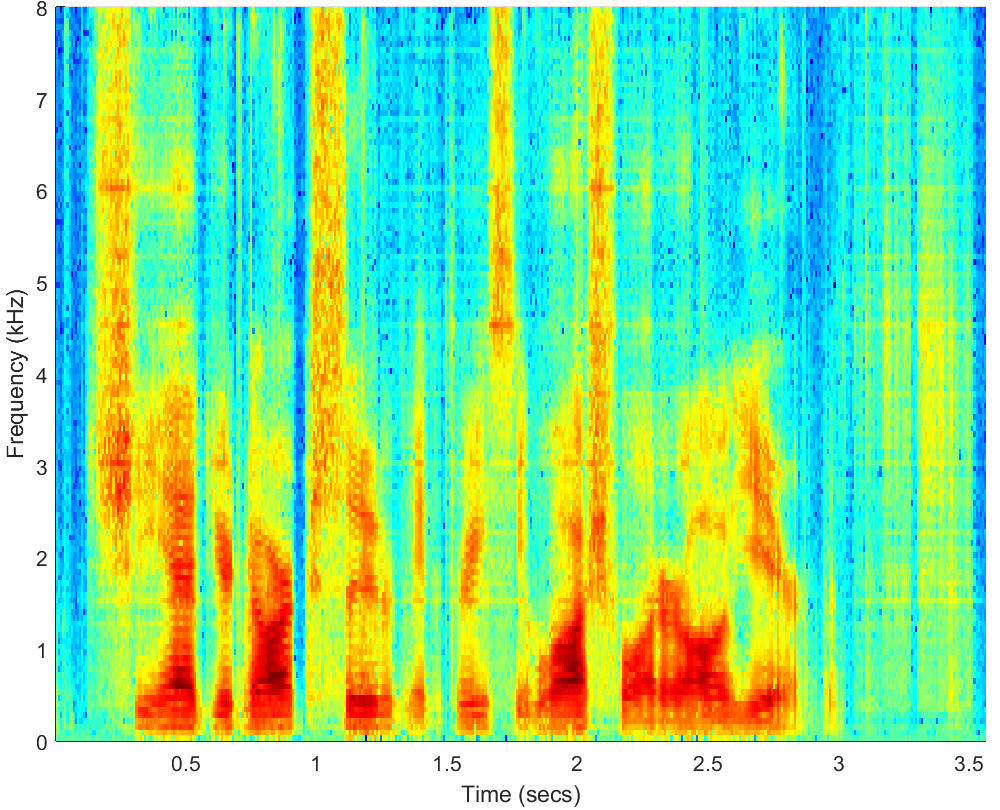
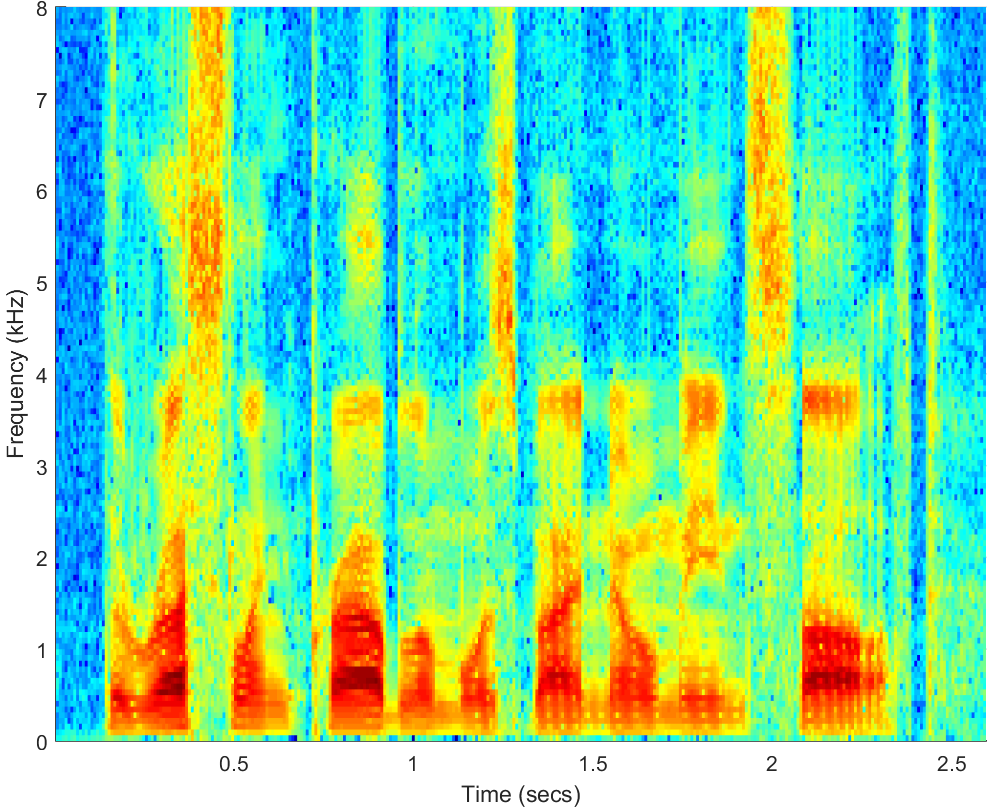
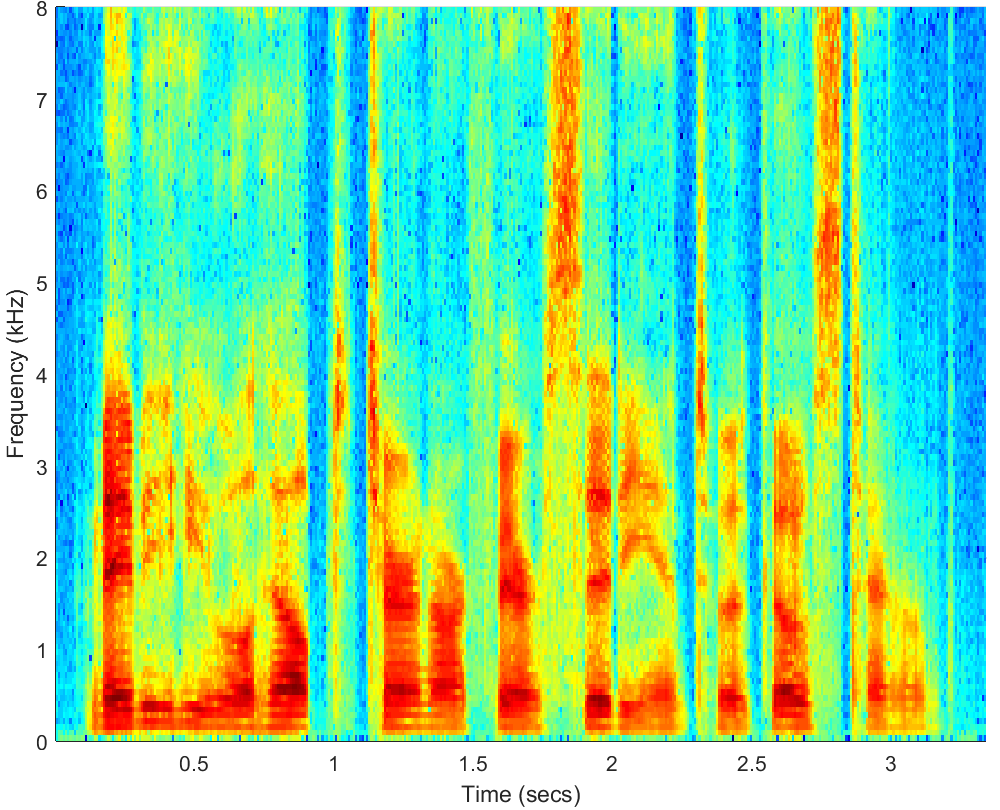
Important: We work in multiple noise conditions. Hence, the acutal noises present in the corrupted speech are mix of several of these noises. A few (22) representative examples of mixed noises
are shown in the Figure below. Please note that for each clean utterance a random set of noises are selected for corrupting it and the shown ones are just a few representations of mixed noises.
Enhancement Examples
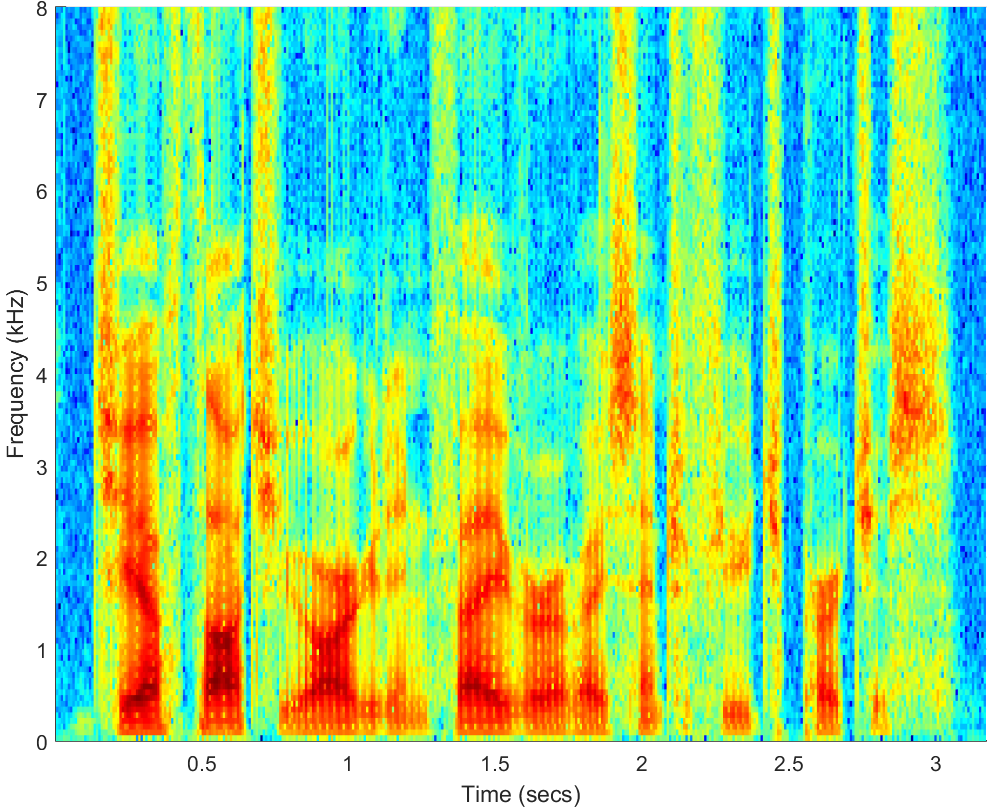
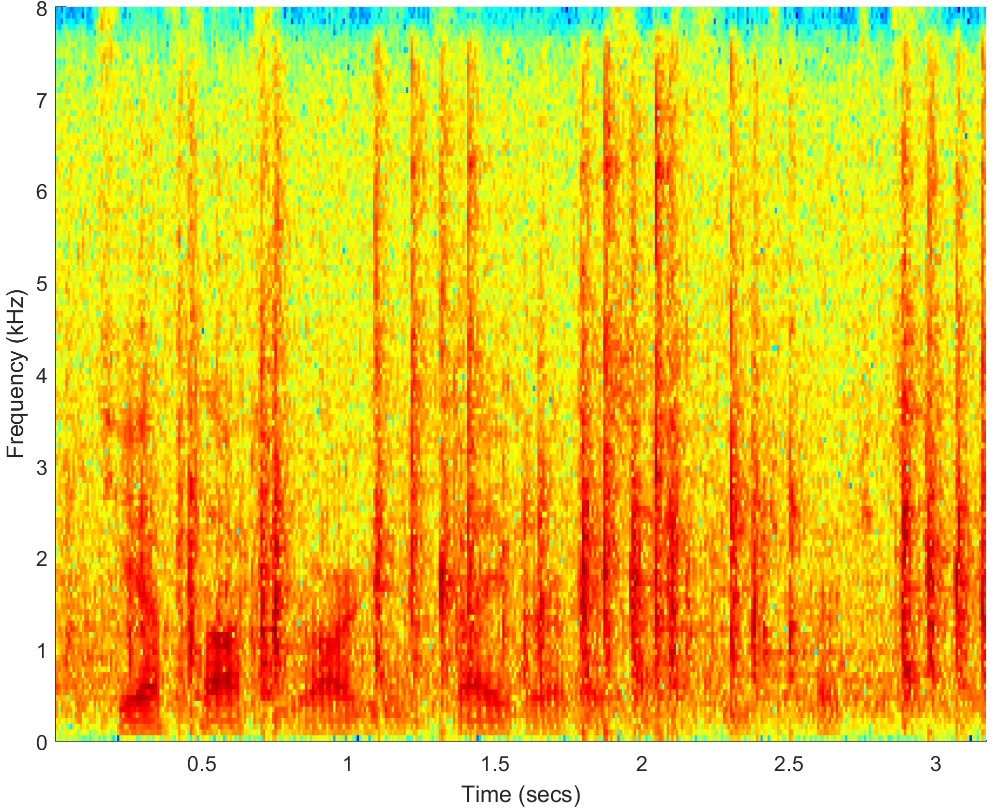
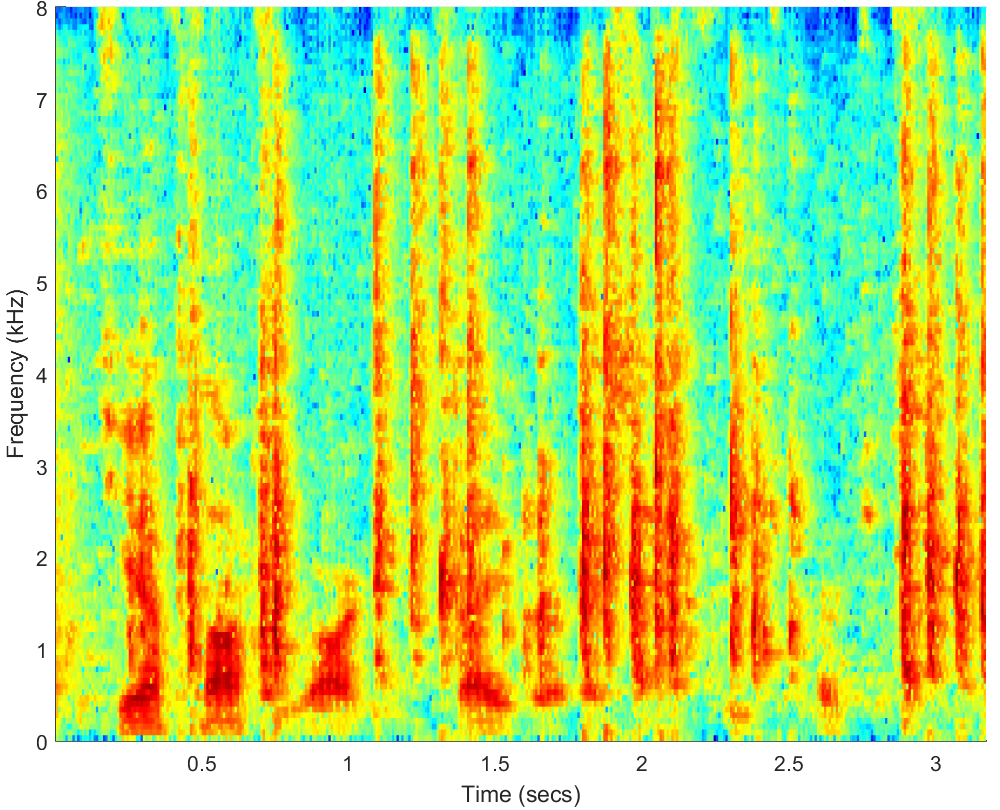
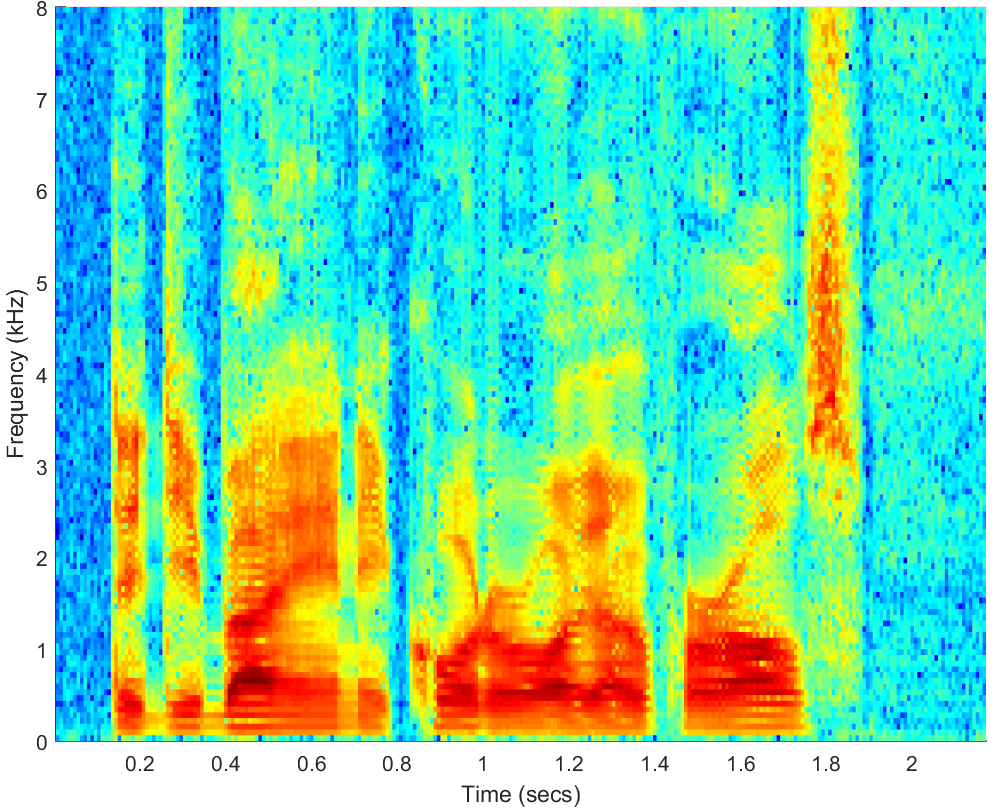
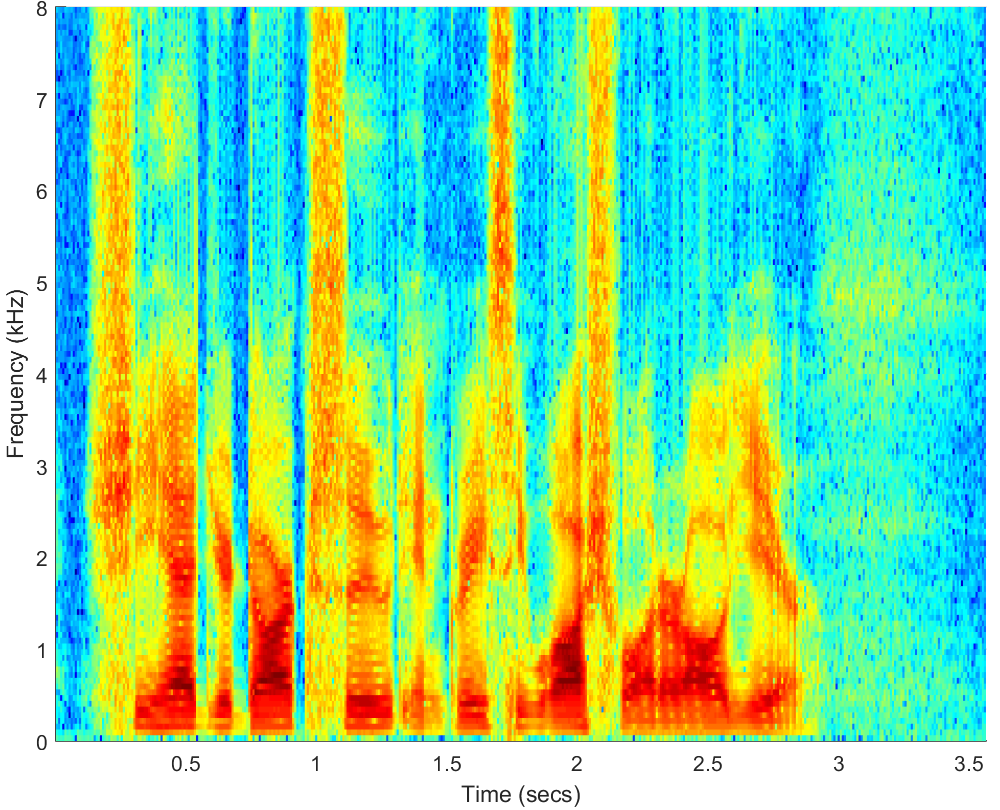
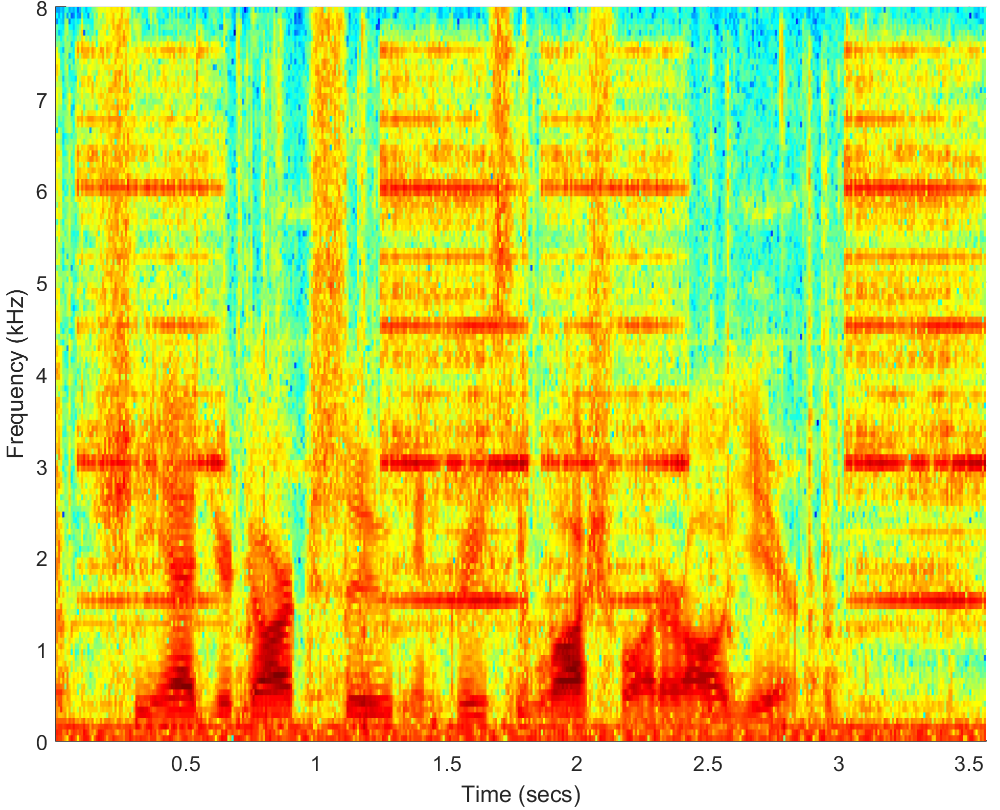
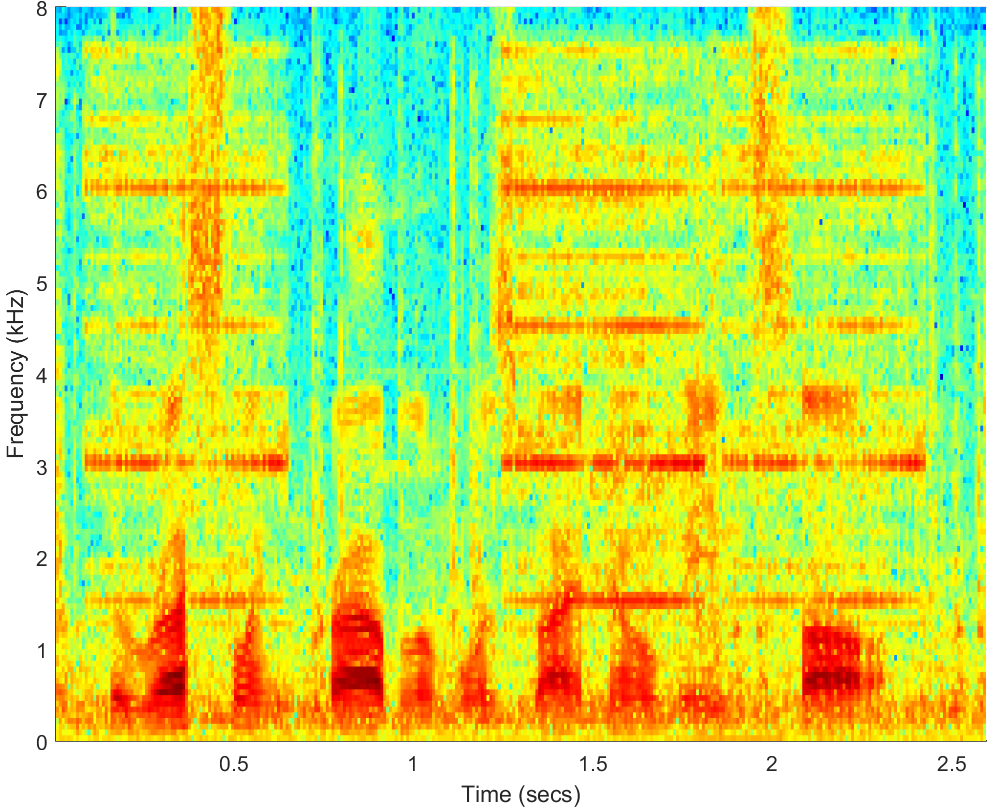
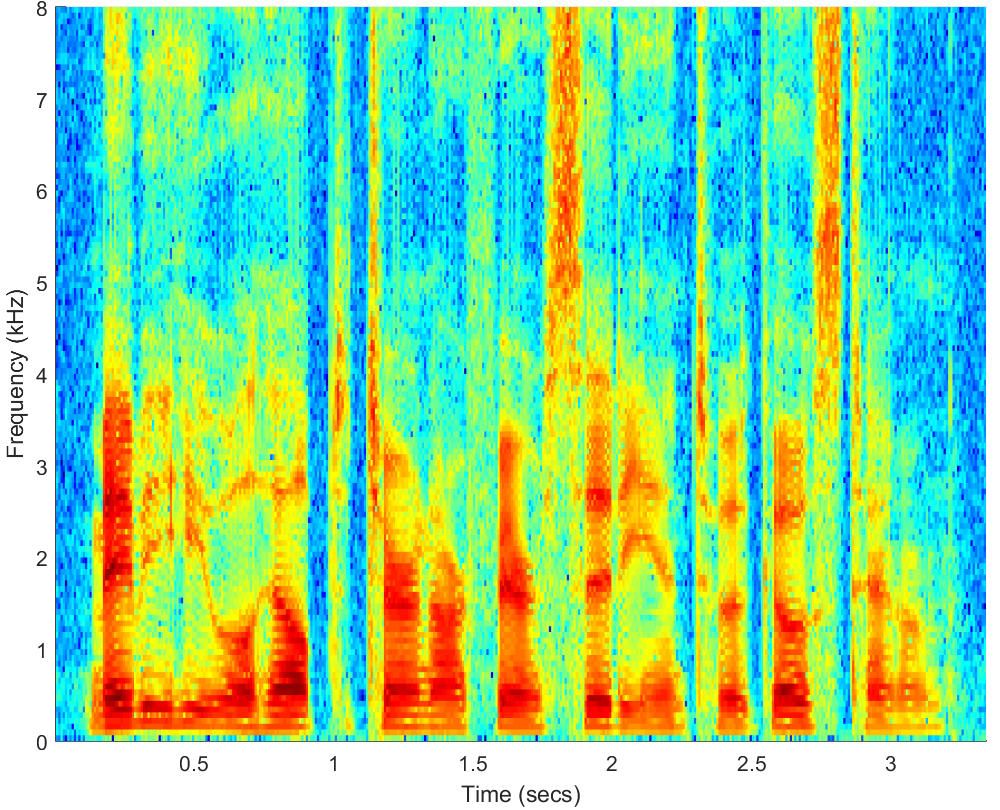
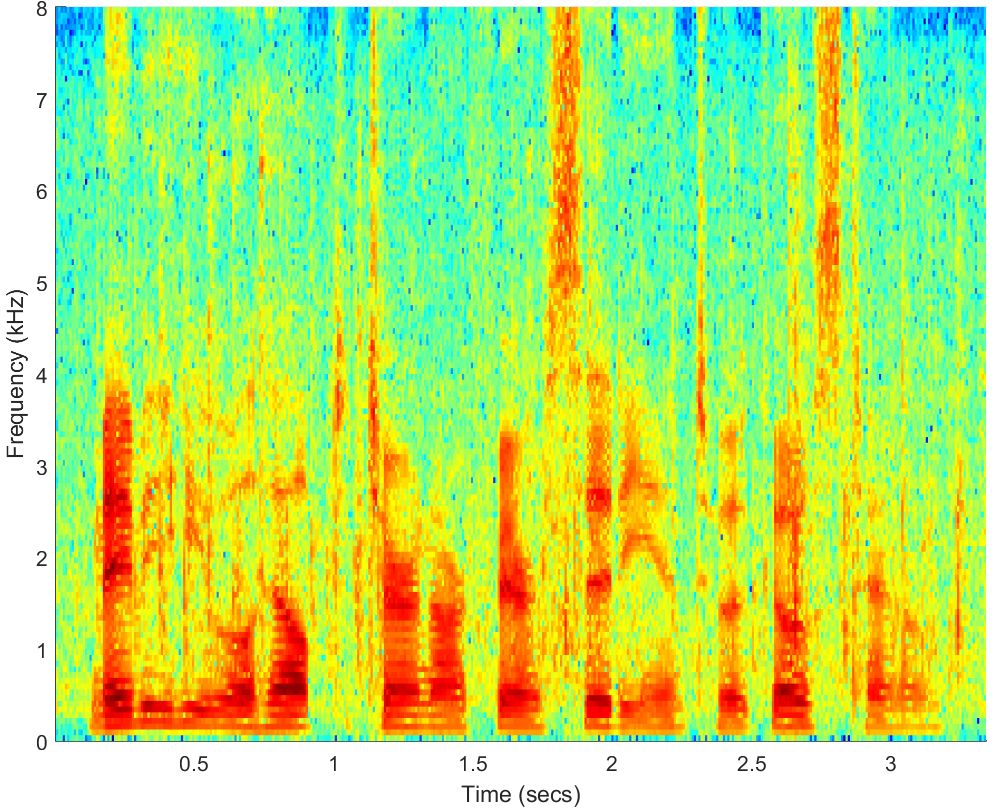
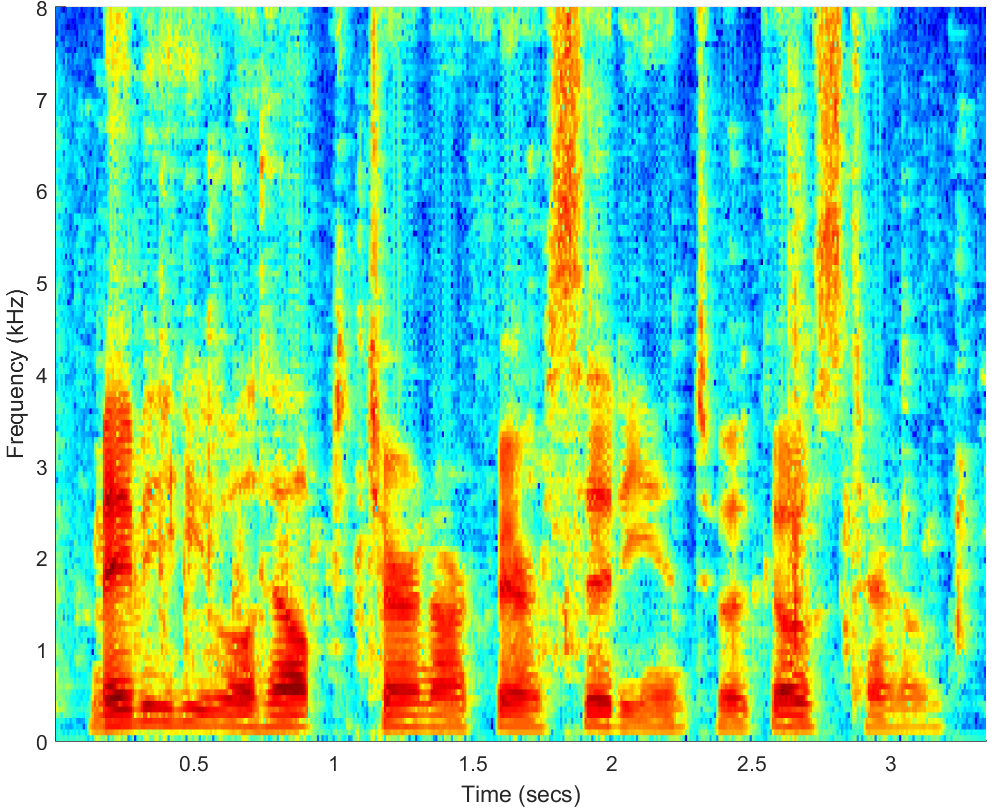
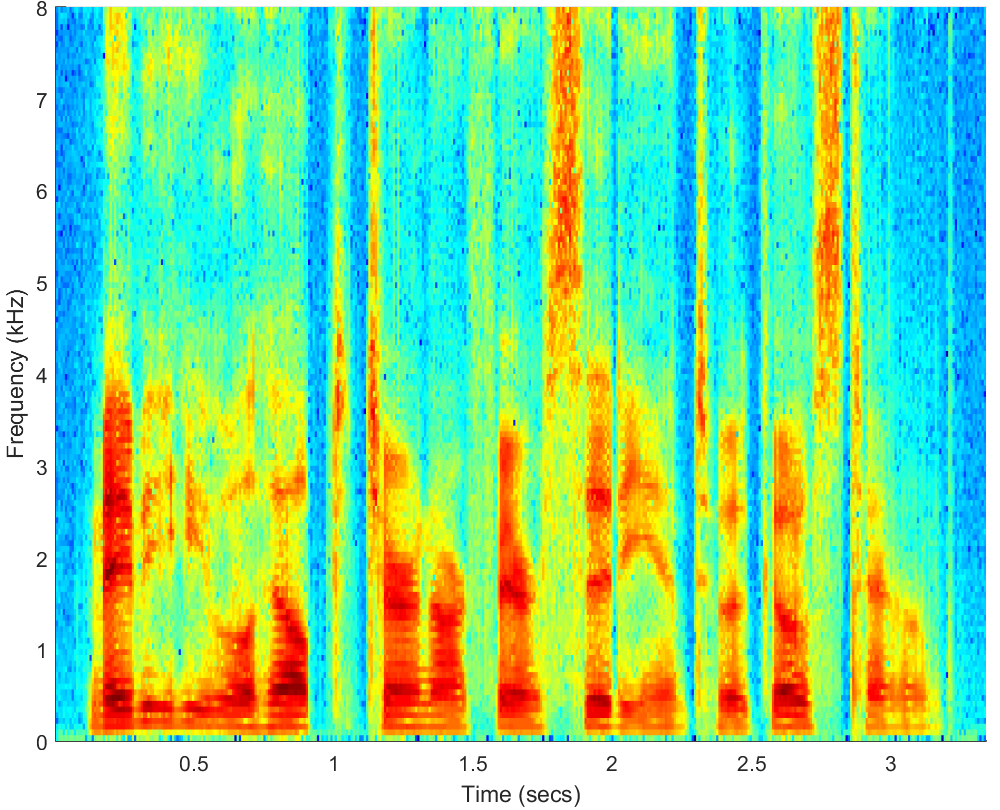
We now show some examples of Speech Enhancement in multiple noise conditions based on the methods described in out paper. As shown in the paper BED on average performs the best in terms of all measures. Hence, for the sake of simplicity we show outputs corresponding to BED only along with the classical Log-MMSE method. We also show the corresponding output obtained using weighted error training (BEWD).
Examples at different SNRs of noise corruption are shown. The PESQ [2] and STOI [3] numbers are also shown for each file.
Click on WAV in each case to listen to the audio.
| # |
Clean speech |
Noisy Speech |
LogMMSE |
DNN(Unweighted Training) |
DNN(Weighted Training) |
| 1 |
WAV
Click on WAV |
WAV(-5dB)
PESQ=0.984, STOI=0.58 |
WAV
PESQ=0.47, STOI=0.54 |
WAV
PESQ=2.25, STOI=0.79 |
WAV
PESQ=2.19, STOI=0.77 |
| 2 |
WAV
Click on WAV |
WAV(-5dB)
PESQ=1.38, STOI=0.44 |
WAV
PESQ=0.90, STOI=0.39 |
WAV
PESQ=1.57, STOI=0.58 |
WAV
PESQ=1.70, STOI=0.55 |
| 3 |
WAV
Click on WAV |
WAV(0dB)
PESQ=1.05, STOI=0.57 |
WAV
PESQ=1.10, STOI=0.57 |
WAV
PESQ=2.27, STOI=0.78 |
WAV
PESQ=2.22, STOI=0.78 |
| 4 |
WAV
Click on WAV |
WAV(0dB)
PESQ=1.81, STOI=0.66 |
WAV
PESQ=2.00, STOI=0.62 |
WAV
PESQ=2.29, STOI=0.64 |
WAV
PESQ=2.55, STOI=0.69 |
| 5 |
WAV
Click on WAV |
WAV(5dB)
PESQ=1.88, STOI=0.78 |
WAV
PESQ=1.58, STOI=0.77 |
WAV
PESQ=3.12, STOI=0.94 |
WAV
PESQ=3.10, STOI=0.94 |
| 6 |
WAV
Click on WAV |
WAV(5dB)
PESQ=2.42, STOI=0.82 |
WAV
PESQ=2.41, STOI=0.80 |
WAV
PESQ=3.10, STOI=0.90 |
WAV
PESQ=3.20, STOI=0.90
|
| 7 |
WAV
Click on WAV |
WAV(10dB)
PESQ=2.35, STOI=0.78 |
WAV
PESQ=2.48, STOI=0.78 |
WAV
PESQ=3.25, STOI=0.92 |
WAV
PESQ=3.20, STOI=0.90 |
| 8 |
WAV
Click on WAV |
WAV(15dB)
PESQ=2.54, STOI=0.95 |
WAV
PESQ=2.71, STOI=0.95 |
WAV
PESQ=3.60, STOI=0.98 |
WAV
PESQ=3.43, STOI=0.97 |
References
[1] G. Hu. 100 nonspeech environemntal sounds. http://web.cse.ohiostate.edu/pnl/corpus/HuNonspeech/HuCorpus.html
[2] A. W. Rix, J. G. Beerends, M. P. Hollier, and A. P. Hekstra, “Perceptual evaluation of speech quality (pesq)-a new methodfor speech quality assessment of telephone networks and codecs,” IEEE, pp. 749–752, 2001
[3] C. H. Taal, R. C. Hendriks, R. Heusdens, and J. Jensen, “An algorithm for intelligibility prediction of time–frequency weighted noisy speech,” Audio, Speech, and Language Processing, IEEE Transactions on, vol. 19, no. 7, pp. 2125–2136, 2011.