MLSP Fall 2015: Homework 3
Clustering and EM Algorithms
Problem 1: Clustering (Zhiding)
You are given a number of toy datasets [here]. Each dataset contains data forming a number of clusters and your mission is to find these clusters using your designed algorithms. The visulized groud truth clustering configuration of these data: Aggregation (K=7), Bridge (K=2), Compound (K=6), Flame (K=2), Jain (K=2), Spiral (K=3) and TwoDiamond (K=2) are shown as follows:
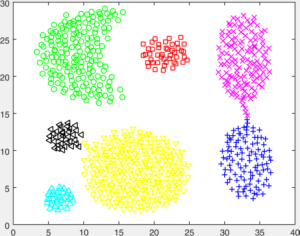
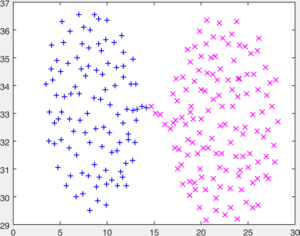
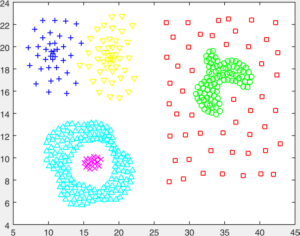
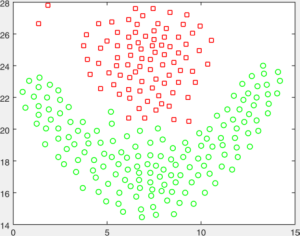
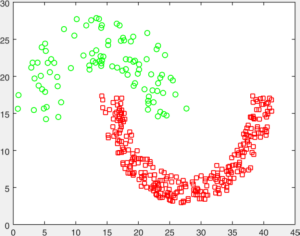
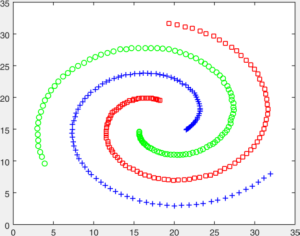
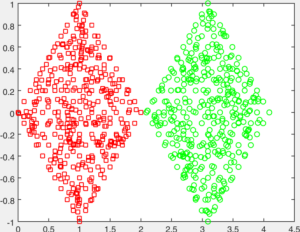
Your task is to implement the code of two clustering algorithms to find the latent cluster structures. In particular, you will implement the code of k-means and spectral clustering.
K-means:
Implement the function of k-means. Your submitted function interface should be function [label] = my_kmeans(data, K), where label is the $N \times 1$ dimensional clustering result, data is the $N \times d$ and K is the number of designated clusters. To initiliaze, randomly select K samples to initilize your cluster centroids. Whenever there happens to be an empty cluster after updating, always choose a sample farthest from current cluster centroids to reinitialize your empty cluster. Iterate your algorithm until convergence (cluster centroid updates are small enough). Use Euclidean distance as the data distance measure. Put your code in the "Problem1" folder as "my_kmeans.m".
In your report, answer the following questions: Is the objective function of k-means a convex one? Can the iterative updating scheme in k-means return a solution which achieve the global minimum of the k-means objective function? If yes, why? If not, why not and are there any practical ways to partially fix this?
Spectral Clustering:
Follow Andrew Ng's NIPS paper [here] to implement the function of spectral clustering. (The paper is well-known and highly cited. But don't panic, the paper is written in a super intuitive way. It should also be very easy to reimplemnt the algorithm, just taking twenty lines of Matlab code.) Your submitted function interface should be function [label] = spectral_clust(data, K, sigma), where label, data and K are the same as above and sigma is the bandwith for Gaussian kernel used in the paper. You will see sigma is important for your clustering performance. Adjust it case-by-case for every toy dataset to output the best results. Use Euclidean distance as the data distance measure. Put your code in the "Problem1" folder as "spectral_clust.m".
Compare your spectral clustering results with k-means. It is natural that on certain hard toy example, both method won't generate perfect results. In your report, briefly analyze what is the advantage or disadvantage of spectral clustering over k-means. Why it is the case? (You do not need to mathematically prove it but just need to give answers that make sense. Don't copy paste answers from the paper, answer it in your own language to show that you have intuitively understood.)
Topscript Code:
Again, write a code named Run_Problem1.m at top level to give the clustering results. In particular, your code should:
1. Load all the mat file data and generate clustering labels with your k-means and spectral clustering codes. In the mat files, "D" is the data matrix and "L" is the ground truth label matrix. To run your clustering algorithms, you don't need "L". It only serves as a reference here.
2. Visualize and save your clustering results to the "results" folder in Problem1. You are given the code "visualize.m" to automatically visualize the result and save it as image files. To use this code, you need to first include the path of "visualize.m" and the whole toolbox of "export_fig" in the "external" folder to your Matlab. You should name your result image files according to the data name. For example, if the data is named "data_Aggregation.mat", then you should save your result as "result_Aggregation.png".
3. Show your visualized results in the report and indicate which method (k-means or spectral clustering) generated them.
Misc
Again, your code of Run_Problem1.m should be runnable with just one click.
In addition, please don't use and refer to any external codes of k-means and spectral clustering. It is not hard to find them. But if you can not implement 20 lines of Matlab code by yourself with clear instructions, then you may not be a qualified MLSP student. Everything here depends on your own integrity.
Problem 2: EM Algorithms (Bhiksha, Bing)
Let $Z$ be the sum of two random variables $X$ and $Y$ ($Z = X + Y$), where $X$ and $Y$ are drawn independently from below discrete probability distributions with probability mass functions defined as:
\[
P(X=n) = P_{1}(1-P_{1})^{n-1} \\
P(Y=n) = P_{2}(1-P_{2})^{n-1} \\
\]
Given samples of $Z$, derive an EM algorithm to estimate $P_{1}$ and $P_{2}$.
Submission Details
The homework is due at 11:59pm on Dec 6th, 2015.
What to submit:
- The answer to all the questions
- The code for all of this
- Always use relative path to make sure your code is runnable on our computers.
Put the above in zipfile (tar is fine as well) called "YourAndrewID.zip". Again, follow the template to structure your codes and answers. The code template is available [here].
Solutions should be emailed to Zhiding and Bing, and cc-ed to Bhiksha. The message must have the subject line "MLSP Assignment 3".