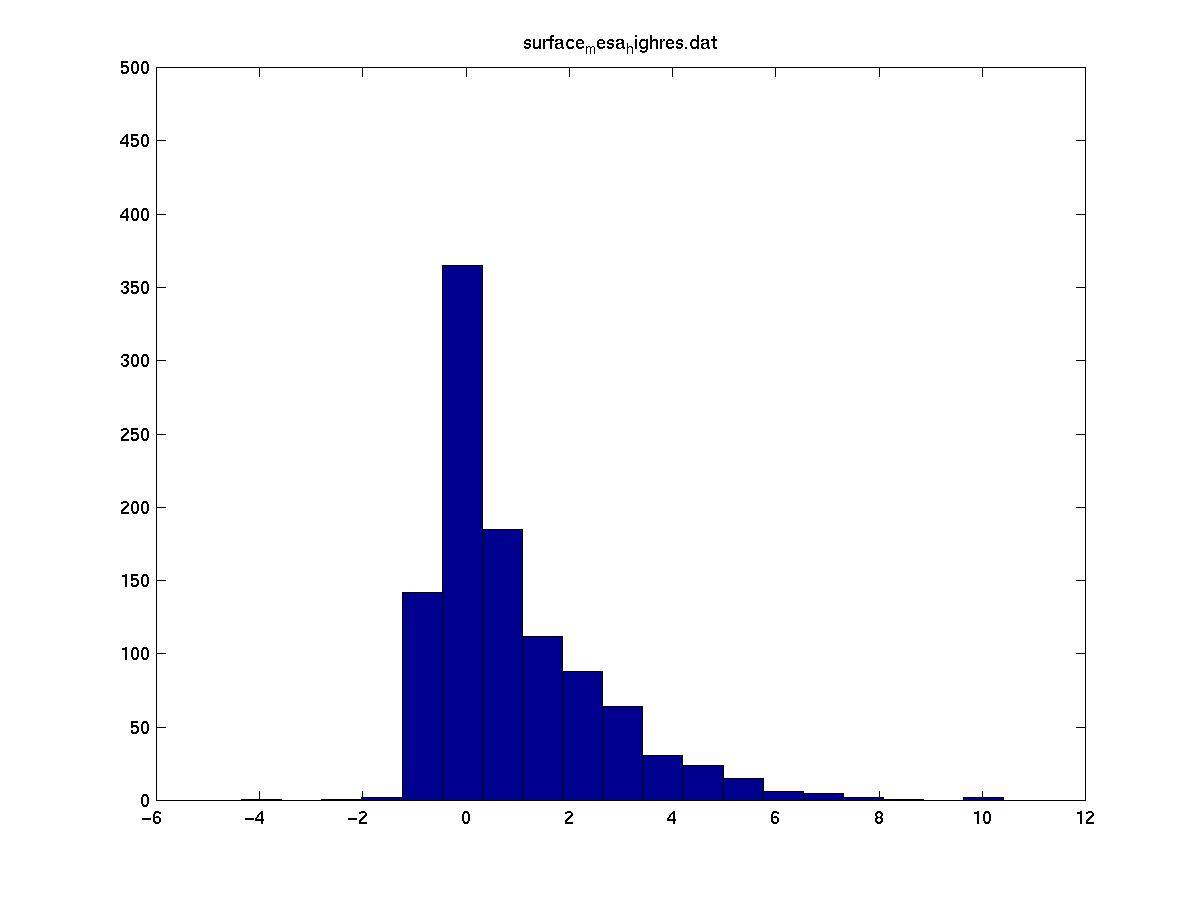

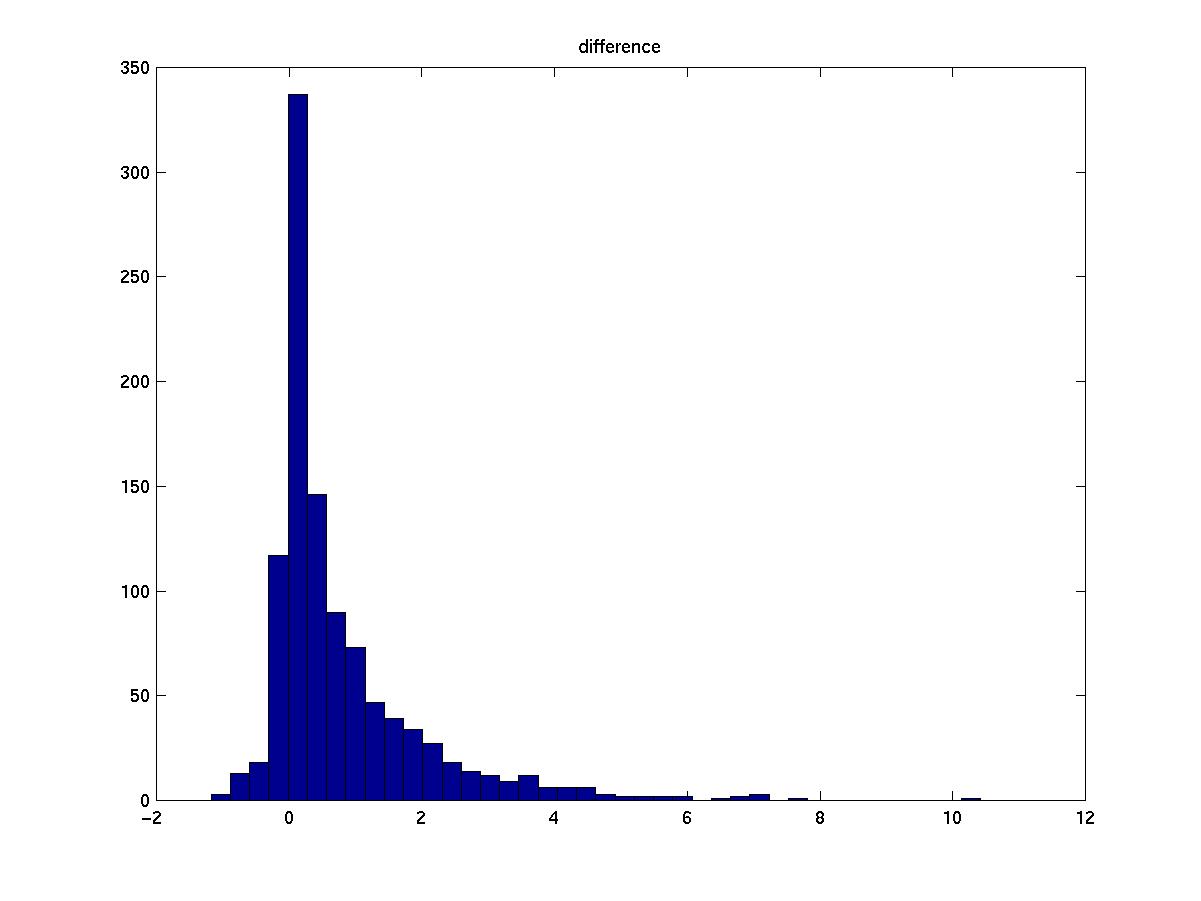
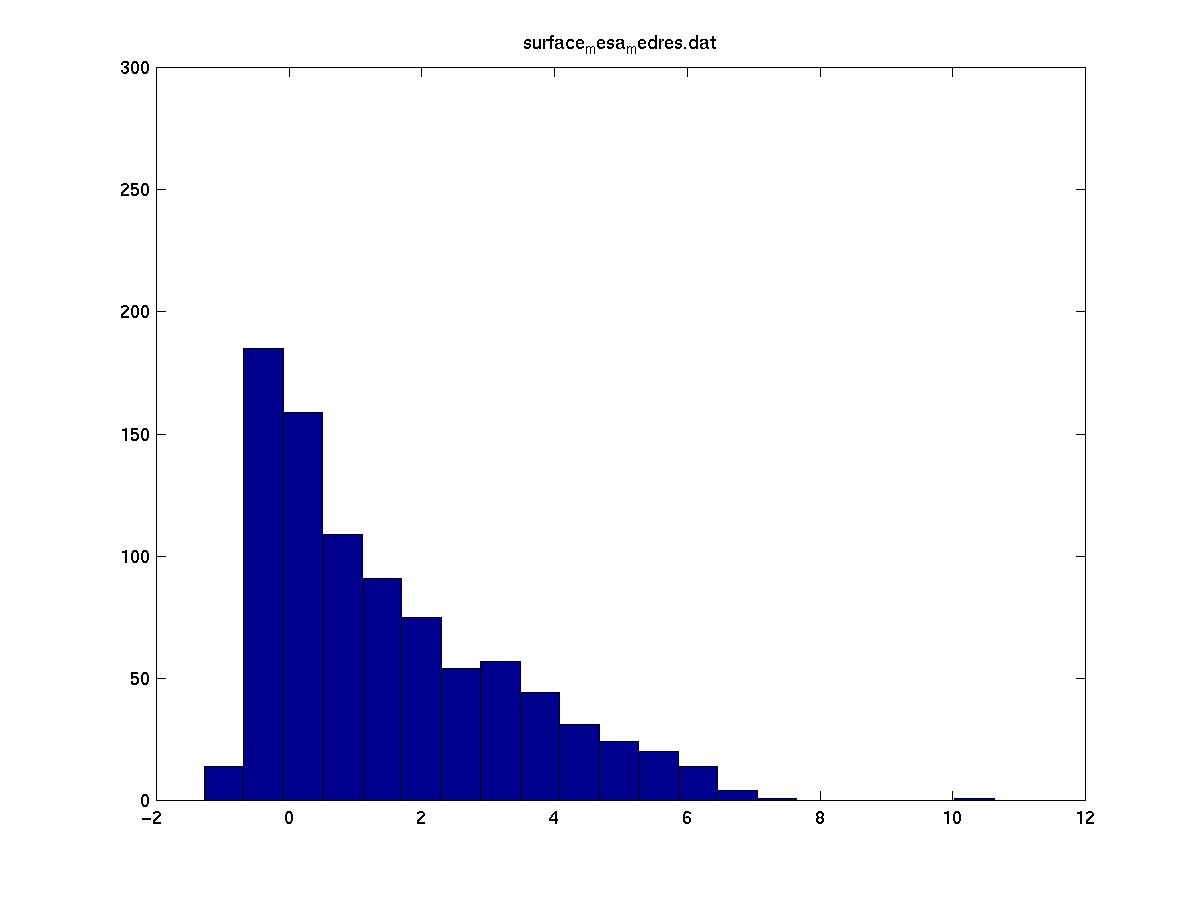
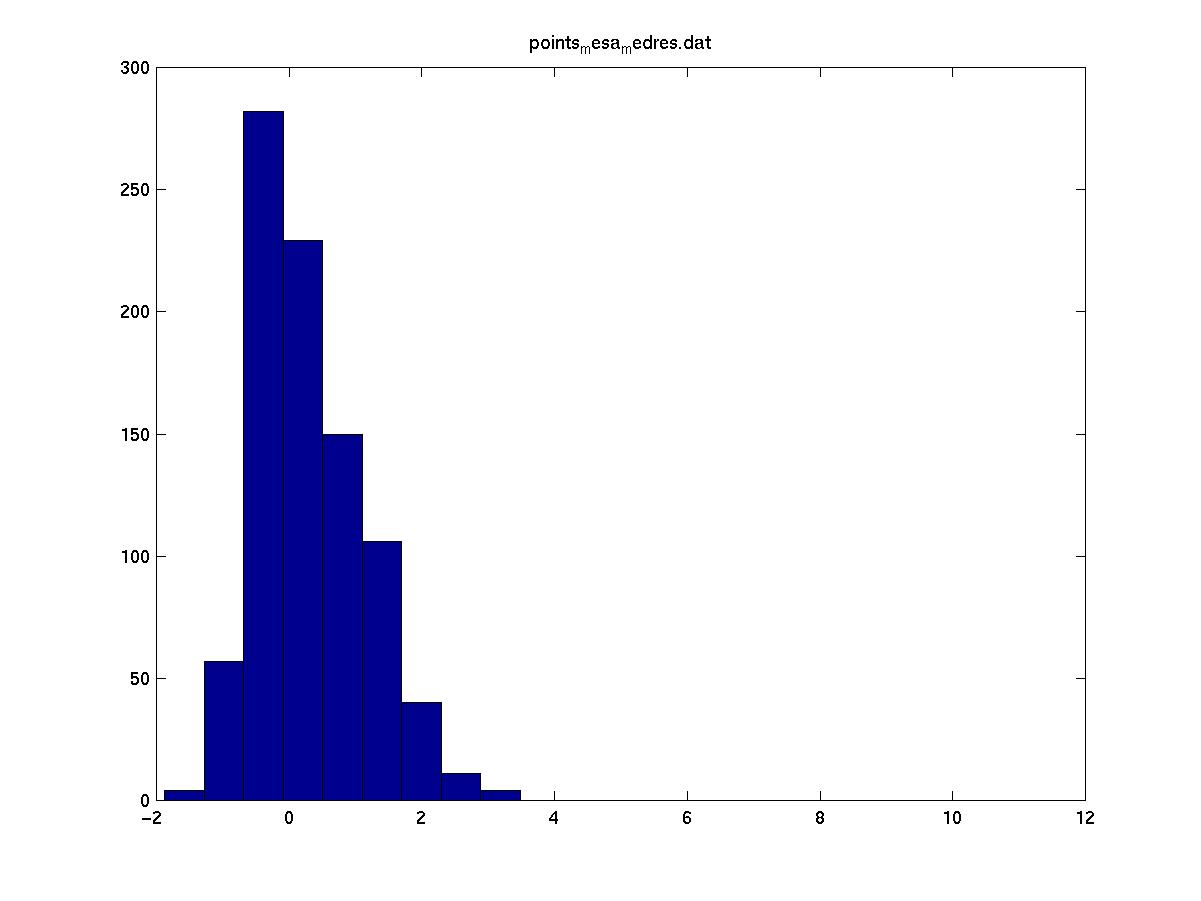
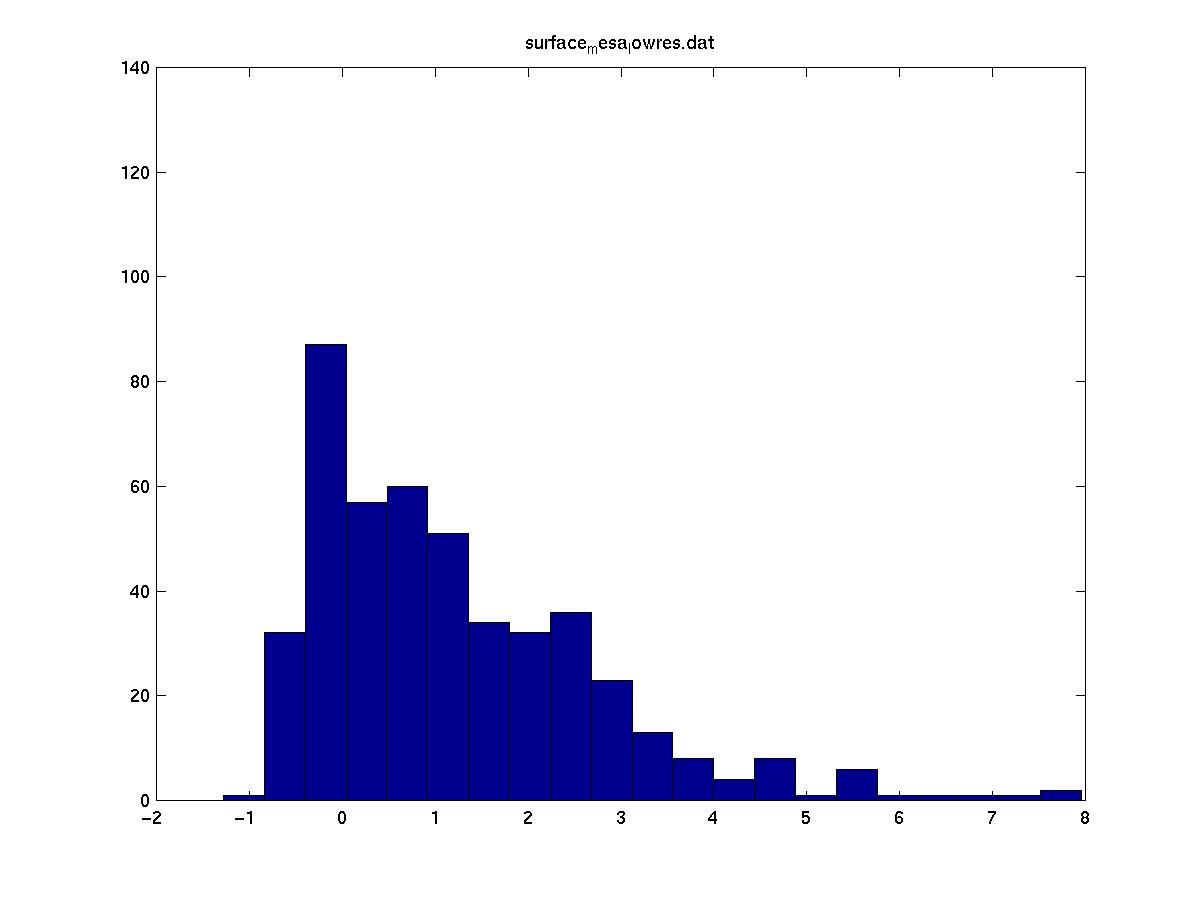
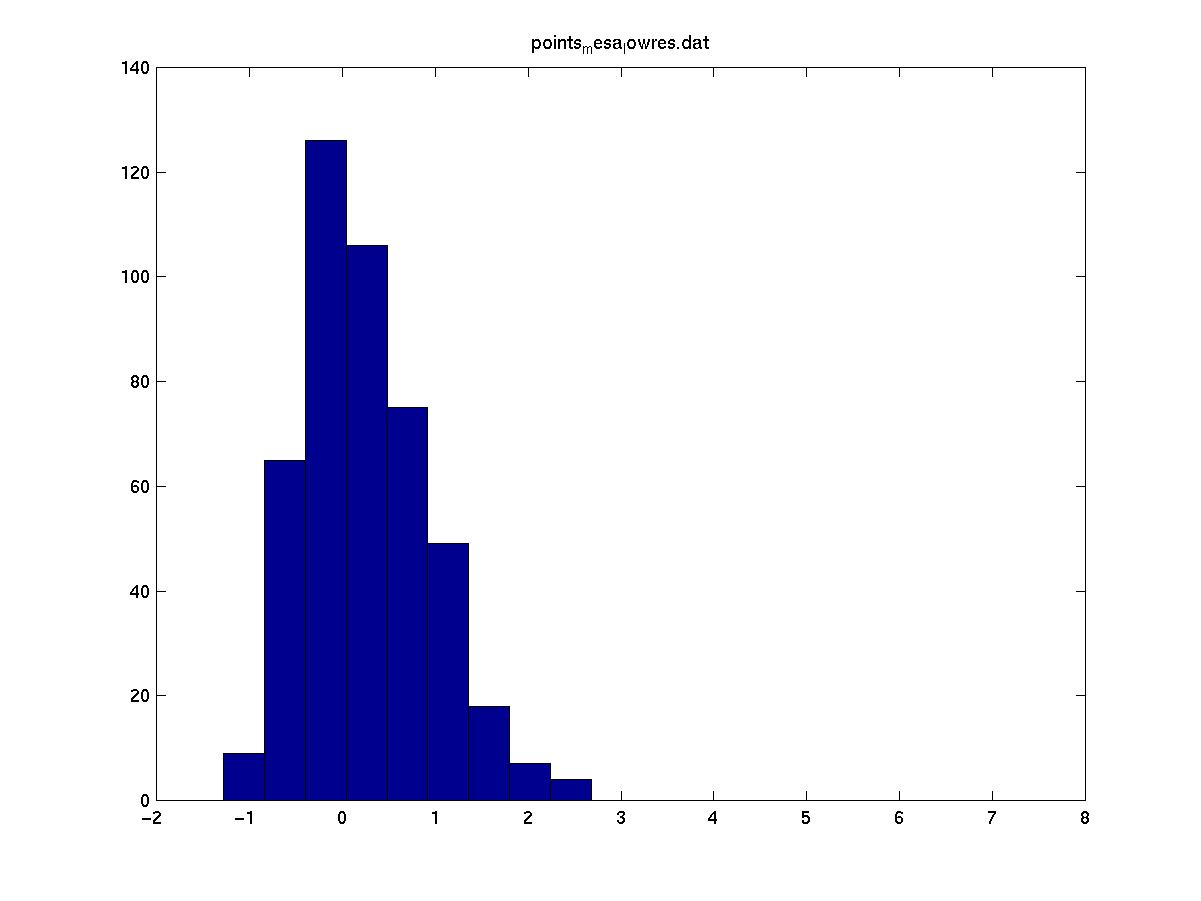
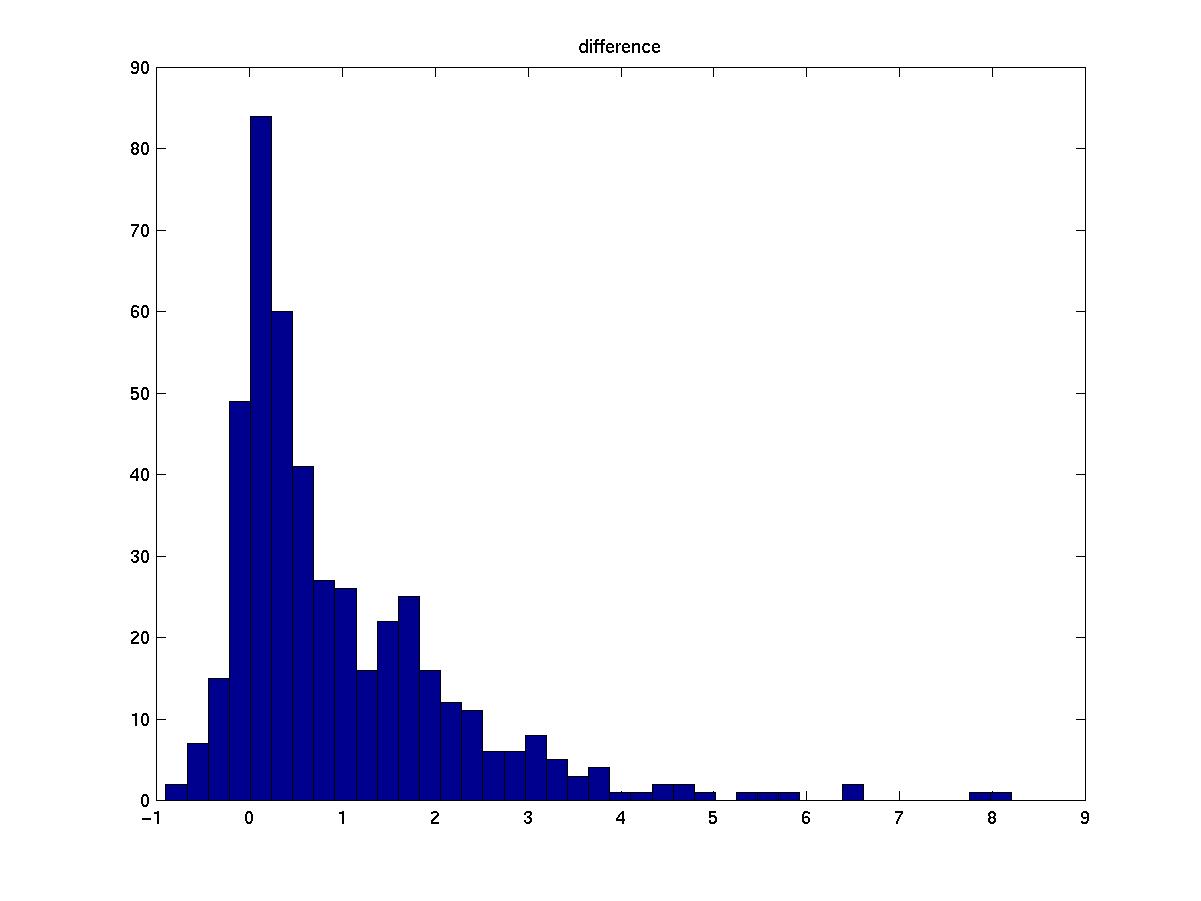
I generate one histogram using spin-images made with the old method (points) and one using spin-images made with the new method (surfaces). The results of this experiment show that the new method increases the correlation measure for corresponding points. The increase is larger for lower resolution datasets.
There are 3 rows of bar graphs below, one row each for high-, medium-, and low-resolution experiments. The resolution is a measure of how much the original mesh was simplified before the experiment was performed. The target number of faces for the three resolutions was 6000, 4000, and 2000 respectively, but some faces were degenerate and were removed after simplification. The first graph shows the histogram of the correlation measure for the integration method, while the second shows the same histogram for the point method. The third graph shows the improvement of each point's correlation value (i.e. the difference between the correlation measure using the integration method and using point method).
High res (3200 pts, 5800 faces):


Med res (2100 pts, 3900 faces):
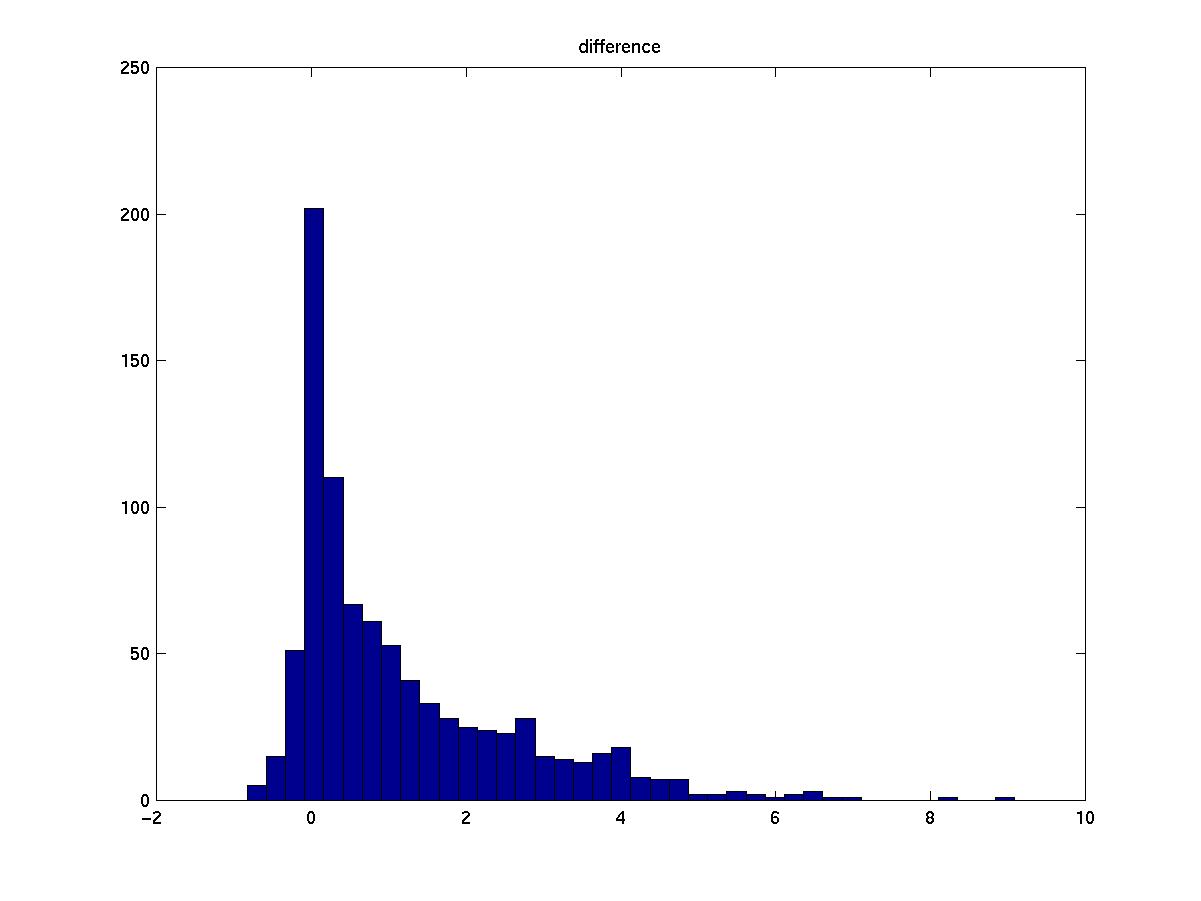
Low res (1100 pts, 1900 faces):
| Last modified June 23, 1998 Daniel Huber ( dhuber@cs.cmu.edu) |