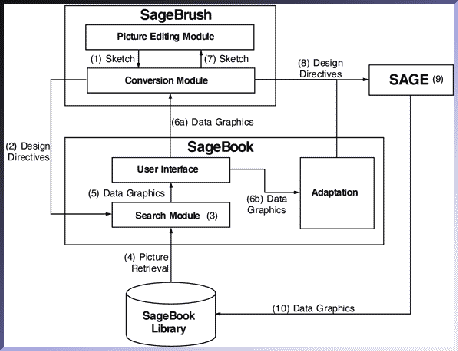
Figure 1: The flow of typical transactions among SageBook, SageBrush, and SAGE.
Mei C. Chuah, Steven F. Roth, John Kolojejchick, Joe Mattis, Octavio Juarez
School of Computer Science
Carnegie Mellon University
Pittsburgh, PA 15213-3890
Tel: (412) 268-2145
Email: mei+@cs.cmu.edu, steven.roth@cs.cmu.edu
Currently, there are many hypertext-like tools and database retrieval systems that use keyword search as a means of navigation. While useful for certain tasks, keyword search is insufficient for browsing databases of data-graphics. SageBook is a system that searches among existing data-graphics, so that they can be reused with new data. In order to fulfill the needs of retrieval and reuse, it provides: 1) a direct manipulation, graphical query interface; 2) a content description language that can express important relationships for retrieving data-graphics; 3) automatic description of stored data-graphics based on their content; 4) search techniques sensitive to the structure and similarity among data-graphics; 5) manual and automatic adaptation tools for altering data-graphics so that they can be reused with new data.
KEYWORDS: Data-visualization, Data-graphic design, Automatic presentation, Intelligent interfaces, Content-based search, Image-retrieval, Information-retrieval
Our approach to supporting the creation of data-graphics is to view their design as two complementary processes: design as a constructive process of selecting and arranging graphical elements, and design as a process of browsing and customizing previous cases. SageBook supports the latter process by enabling users to find, browse, and apply previously created data-graphics to the construction of new ones that reflect current data and design preferences.
Current data-graphic design tools, particularly those provided with spreadsheets, do not support these processes well because they do not enable people to combine diverse information in a single graphic. They are unable to integrate different kinds of graphical objects, properties, or chart types to show the relationships among many data attributes. Instead, isolated graphical styles must be selected individually from a lengthy menu (e.g. charts with bars, charts with lines, charts with plot points, etc.).
There are constructive tools that enable users to assemble or sketch combinations of graphic elements flexibly [5,8]. These tools support a vast number of different data-graphics based on the combination and organization of many graphical elements (e.g., those in Figures 2, 4, 7, 9). Nevertheless, constructing a data-graphic, especially one that contains a lot of information, still requires a user to have substantial design expertise. Even expert designers may need ideas when working with new data sets, and a good source of ideas exists in other users' successful visualizations of similar data.
One of our approaches to providing expertise has been to give users access to a library of data-graphics, created by users of a constructive system called SageBrush or created automatically by a related knowledge-based system called SAGE [8]. Since searching a portfolio of hundreds of data-graphics can be laborious, we created SageBook, a content-based search and browsing tool that enables users to retrieve data-graphics based on their appearance and/or the properties of the data they present.
In [8], we gave an overview of the three components of our system (SAGE, SageBrush, and SageBook), but primarily focused on SageBrush. In this paper, we focus on SageBook's browsing interfaces and mechanisms for content-based search and reuse. SageBook's goal is to provide content-based retrieval facilities in the context of supporting user-directed, data-graphic design. To fulfill this goal, we identified five crucial needs:
Nishiyama et al. [6] described an image-retrieval system that searches based on the relative position of objects in a photograph, and on some object attributes. Queries are graphical sketches, so users need not learn a keyword system (thus reducing the mismatch problem). However, the content description language and query interface are limited to six object types. As was shown in their evaluation, this is insufficient to describe the space of pictures that might be in the library. As in Garber's system, pictures in the library are manually indexed.
TRADEMARK [3] is an image-retrieval system that does matching based on physical features (e.g. colors, lines) of images. Using image analysis techniques, TRADEMARK can automatically index or sort its library. However, this type of search (characterized as "machine-oriented" in [6]) does not produce a content description beyond the surface features of the image. Therefore, it is unable to search for concepts like "person" or "beach". Furthermore, the interface requires users to create a detailed query also at the surface feature level.
ART MUSEUM [3] is an image-retrieval system for art pieces. Its search criteria are graphical features and keywords of artistic impressions. The search for graphical features is based on the physical appearance of the pictures (e.g. color, texture) and has the same limitations as TRADEMARK. The artistic impressions associated with each picture have to be manually entered. Furthermore, the search done on artistic impressions is a keyword matching process, making it especially sensitive to vocabulary mismatches.
None of these systems provide adaptation tools because they were created for the task of image-retrieval only. In data-graphic design, reuse is a primary user task, thus adaptation facilities are of the utmost importance. Reuse involves extracting the design that was inherent in an existing data-graphic and reapplying it to the design of a new data-graphic.
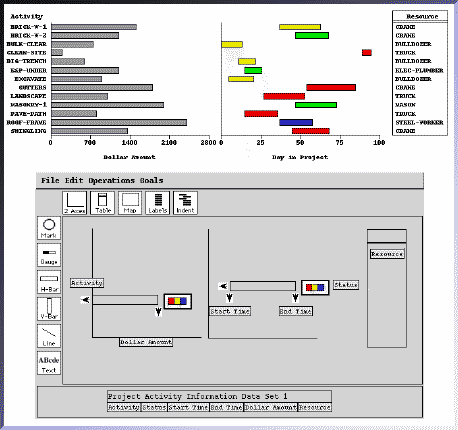
We have designed a system that directly supports the five needs of a retrieval and reuse facility for data-graphic design. Our system provides users with a direct manipulation interface (shown in Figures 2 and 7) to pose complete or partial data and graphic queries. A query is translated into a content description language, which has also been used to express automatically-generated descriptions of the data-graphics in SageBook's library. SageBook compares the query with these descriptions and retrieves a set of data-graphics that fulfills its similarity tests (Figure 7). Users can then manually or automatically adapt these data-graphics as desired. We first give an overview of the interactions and information flow among system components, and then we discuss how we deal with the needs of retrieval and reuse.
SageBook is integrated with two other modules: SageBrush and SAGE. SageBrush is a tool for sketching data-graphics from primitive graphical elements; as such, it can be used both as a design space and query interface. SAGE is an automatic presentation system. Details on SAGE and SageBrush can be found in [8].
A retrieval transaction emphasizing the relations among SageBook and the other modules is shown in Figure 1.

The process of retrieval and reuse described above can be divided into four phases, each emphasizing the different needs of information retrieval and data-graphic design.
The following sections describe each of these phases in detail and explain how we dealt with the retrieval and reuse needs that were previously raised.
Queries are constructed in SageBrush by assembling graphical sketches or by selecting data-domains (i.e. database attributes) to be visualized. Interface details are provided in [8]. Whether querying based on graphical or data content, users do not need to know a complex vocabulary for describing that content. They do not have to learn the terms the system uses internally to refer to axes, map spaces, interval bars, gauges, indented text, etc. Instead with SageBrush, they can select and arrange spaces (e.g. charts, tables), the objects contained within those spaces (e.g. marks, bars), and the objects' properties (e.g. color, size, shape, position). Likewise, users do not have to learn the terms for describing the characteristics of data, like scale of measurement (nominal, ordinal, quantitative) or relationships among data-domains (functional dependency, interval, 2D coordinate). Instead, they simply load the data-sets that they wish to peruse into SageBrush's data area, and select the data-domains that they wish to visualize. This is in contrast to previous systems [2,3,10] that require users to specify the characteristics of the query object via keywords. Systems that do not provide direct-manipulation query interfaces force users to learn an underlying object description language.
SageBrush contains methods to convert a data or graphical query into a language (design directives) that is understood by SageBook and SAGE. When users select a data set of current interest, the system extracts the characteristics of each selected data-domain (attribute) and reformulates the query in terms of underlying data properties.
SageBook does require data objects to be characterized when the data is first created. Currently, this characterization must be provided by database creators. We expect to be able to build modules that extract this characterization either by examining the information typically stored in databases (e.g. relation schemes), by examining the data itself, or by interacting with users. However, once data is characterized and stored, users need not be aware of the characteristics or the language that is used to describe them.
In addition to serving as a query interface, SageBrush can also be used to construct data-graphics and to manually adapt retrieved data-graphics. Because of SageBrush's multiple functionality, any data-graphic that can be constructed can also be queried.
A common data and graphic representation is used by all the modules of our system. It provides a vocabulary that is capable of expressing the syntax and semantics of data-graphic designs, and of characterizing the data contained within them. It is able to express the spatial relationships between graphical objects, the relationships between data-domains, and the various graphic and data attributes. Through this language, the content of data-graphics can be fully described.
A query specified by the user with data and graphical symbols is first translated into this internal representation before it is passed to SageBook for processing. This common language allows the user and the different modules of the system to communicate without any vocabulary mismatches. In addition, all data-graphics generated by SAGE are described using this language. SageBook, in turn, uses the description associated with each data-graphic as an index for its search strategies. As a result, all data-graphics in the SageBook library are automatically indexed by SAGE when they are first generated. This is a significant advantage compared to other visual search systems [2,3,6], which require the descriptions of images in the graphic library to be manually entered as keywords.
The data characterization has been described in [9] and is not repeated here. It includes the scales of measurement (nominal, quantitative, ordinal), structural relationships among data (such as between the endpoints of ranges and between the two domains of a geographic 2D coordinate), and the dependencies among domains (e.g. whether a person has one or more birthdates, residences, or children). However, we will briefly describe the main structures of the graphical representation that relate to SageBook in order to facilitate an understanding of the search procedures.
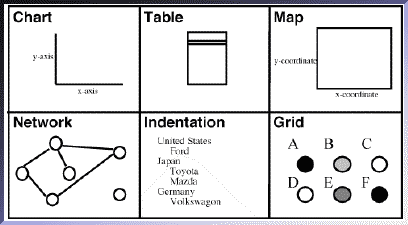
Each data-graphic is described as a design specification, which >consists of several spaces. Each space represents a grouping of graphical elements that are positioned according to a single layout discipline. There are many types of layout disciplines; some examples are shown in Figure 3
Within each space there may be several objects called graphemes. Examples of graphemes are marks, bars, text, lines, and gauges. Each grapheme uses different properties to define its appearance. Some of these properties may be used to encode data-domains or distinguish different relations shown in the same space. For example, Figure 4 shows a data-graphic of steel-factory data. This graphic was designed using SAGE and it uses the size of the marks in the first space to encode billet-thickness and the color of the bars in the second space to distinguish between materials-cost and labor-cost. Attributes not encoding domains or relations have default values (e.g. the color of the marks).
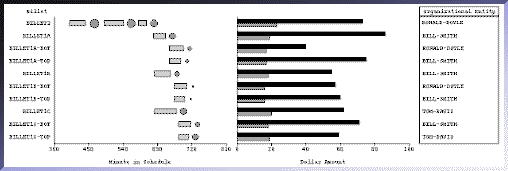
Figure 5 expresses the data-graphic in Figure 4 in terms of its constituents. The data-graphic contains three horizontally aligned spaces. Two of the spaces use the chart layout discipline and one the table layout discipline. Within the first space are two sets of graphemes: marks and interval bars. The position of the interval bars is used to express the furnace schedule for the different billets, and the size of the marks is used to express billet-thickness. The second space contains two sets of bar graphemes that use the color property to distinguish the two cost data attributes that the bars encode. Their lengths encode the data values. The last space has a set of text graphemes whose lettering encodes data.
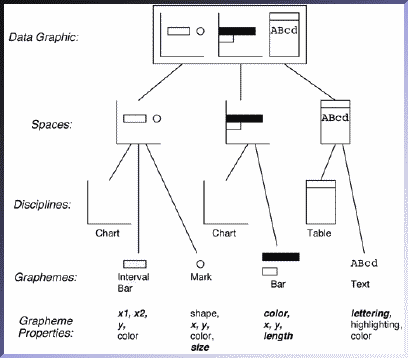
Thus, the content description language describes: classes of objects, the spatial relationships among spaces and graphemes, the graphical properties of objects, and the way that those properties are assigned to data.
The process of matching a user query to the SageBook library is carried out by two components of the search module: the data-matcher and graphic-matcher. The graphic-matching component has three alternative match strategies and the data-matching component has four. The different match strategies provide different degrees of relaxation on the search criteria based on the degree of overlap between the library data-graphic and the user query. Each retrieves a different number of data-graphics depending on its degree of relaxation. Partial overlap matching or similarity matching was shown to be important and useful in Garber's photograph retrieval system [2].
A typical reason for relaxation is to find compromises in lieu of finding exactly what one wants. Additionally, similarity-based relaxation finds items that are equally desirable but that would otherwise not match because of insignificant feature differences. Most importantly, supporting data-graphic design suggests an additional function of relaxation: giving users ideas for how to integrate additional graphical elements and properties with partial designs they have created. The latter answers questions such as: How can additional graphemes be added to the space I've created and integrated with the graphemes I've already included? How have previous data-graphics used additional properties of these graphemes? How can other spaces or graphemes be substituted for the ones I've selected to express the same data? Enabling users to answer questions like these motivated the choice of match criteria that evolved in SageBook. Finally, our choice of criteria reflected the fact that it was easy for users (or the system) to remove extra spaces, graphemes, and properties when adapting the design for new data.
The search strategies in SageBook are based on the structural properties of the graphical and data elements in a data-graphic. Structural search is more robust and powerful than keyword search because:

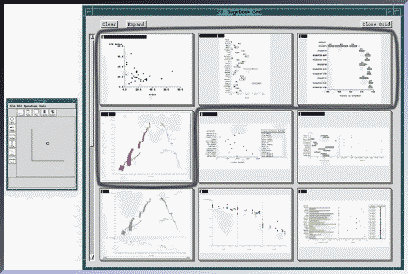
Figure 7 shows a graphical query (i.e. sketch) and the data-graphics retrieved with that query, using a moderately-relaxed matching strategy. SageBook provides the following three alternative graphic-matching strategies.
Close Graphic-Matching: This strategy searches for library data-graphics that have the same number of spaces as the query. In Figure 7, this strategy would have retrieved the first four stacks of similar data-graphics (i.e. the stacks outlined in black). These data-graphics only contain one space because the query has only one space.
For a space in the query to match a candidate space in a library data-graphic, both must employ the same layout discipline, and every grapheme in the query space must match a grapheme in the candidate space (i.e. the candidate space may contain unmatched graphemes, even though the query space may not). For a grapheme in the query space to match a candidate grapheme, both must have the same grapheme-class (e.g. bar, line, mark), and every property specified in the query grapheme (e.g. color, shape, size) must be used by the candidate grapheme. Using this search strategy, the query in Figure 7 will retrieve only those data-graphics consisting of a single chart that contains at least one mark grapheme. Note that only the positional properties of the mark were specified in the query; thus retrieved data-graphics may use additional grapheme properties that the query did not specify.
Subset Graphic-Matching: This strategy is more inclusive than close graphic-matching. In subset matching, a library data-graphic may contain more spaces than the query, as long as every query space matches a space in the data-graphic. This strategy retrieves all of the stacks of data-graphics in Figure 7. The stacks are sorted according to their degree of similarity to the query, based on the match criteria. For example, in Figure 7, all one-space matches are shown first, followed by all two-space matches, etc.
Subset matching supports a process resembling a library search. First, the user enters a query and retrieves a super-set of data-graphics, each of which will contain every element specified in the query. If the set is too large, the user can narrow it by adding more constraints or features to the query. The user may then browse through the data-graphics, and pick one based on other criteria. Any unwanted spaces can be easily deleted from the data-graphic using SageBrush.
Overlap Graphic-Matching: Subset matching may exclude data-graphics that are useful but fall slightly short of meeting the match criteria (i.e. that every query space must match a space in the library data-graphic). Thus, in addition to a strict subset search, we implemented a match strategy that sets upper and lower bounds around the number of query spaces that need to be matched. These bounds are set to be percentages of the total number of spaces in the query.
Data-Relation Matching: This strategy searches for library data-graphics that contain every relation that was specified in the query. This matching strategy is useful when sets of daily or weekly data must be redisplayed in a consistent style. This also suggests an additional use for data-graphic retrieval - searching for information (rather than just graphic displays) stored as graphic media.
Close Data-Matching: This strategy enables users to find graphics showing data that has similar characteristics to their current data. Given a list of domains (i.e. the query) and their characteristics, the close data-matching algorithm tries to find a mapping from the query domains to the domains in a library data-graphic. For a query domain to match a candidate domain in a data-graphic, they must have the same data-type (nominal, ordinal, quantitative) and frame of reference (quantitative/valuation, coordinate), and must participate in the same kinds of functional-dependencies and complex types. Figure 8 shows an example of this data-matching process. Activity matches houseID (both have nominal data-types), and materials-cost matches number-of-rooms (both have quantitative data-types). Start-date and end-date match with date-on-market and date-sold, since they both have the same frame-of-reference (coordinate) and belong to the same complex-type (interval type). This matching process ensures that the domains in the library data-graphic and the query are equal in number, and match one-to-one, as Figure 8 illustrates.
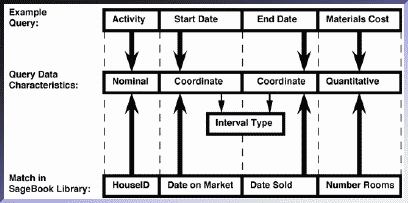
Unlike the relation matching strategy, which requires the query and library data-graphic to contain the very same relations, the close data-matching strategy only requires that the domains have similar data characteristics and interrelationships. Thus, this strategy is not a keyword search, but rather is a search based on a similarity of structure between data-sets.
Subset Data-Matching: The idea behind this strategy is analogous to that of subset graphic-matching. Subset data-matching is like close data-matching, except that instead of requiring a bijective (i.e.one-to-one and onto) mapping between domains in the query and the library data-graphic, subset matching allows the library data-graphic to contain more domains than the query, as long as every query domain matches a domain in the data-graphic.
Overlap Data-Matching: As with graphic-matching, a variant of the subset data-matching strategy was created that sets upper and lower bounds around the number of query domains that need to be matched, instead of using a strict subset rule.
If the SageBook library contains hundreds of data-graphics, some queries may retrieve a large set of items. In such cases, the cognitive load placed on users to browse through the retrieved data-graphics would be significant. To support browsing, we developed a scrollable, grid-like interface that enables multiple data-graphics to be viewed at once (Figure 7). Our recent work has been on exploring ways to enhance browsing efficiency by grouping similar data-graphics into a stack in one cell of the grid. The number of data-graphics in a stack is indicated by the length of a black bar at the top of each cell. The expand operation can be used to distribute members of any stack into a new grid. An interesting challenge has been to develop effective grouping strategies (i.e. similarity criteria) for organizing a large number of data-graphics into a small number of meaningful stacks. The formal representation of data-graphics provides a framework for grouping strategies, as it did for graphic and data queries.
Since SageBook's purpose is primarily to help users' get design ideas, we defined four criteria that increased design differences between stacks by grouping similar data-graphics together. The method names reflect the aspect of the data-graphics within a stack that can be different. Data-only groups into a stack all those data-graphics that have the same number and types of spaces, ordering of aligned spaces, types and number of graphemes within each space and properties of graphemes. Effectively, these are cases in which the same design was saved for different data. The spaces-order method groups together the same data-graphics as the data-only method, but in addition, it includes data-graphics that have identical designs except for the ordering of aligned spaces. For example, data-graphics like the one in Figure 4 would be stored in the same stack regardless of the left-to-right ordering of the three spaces.
The two techniques mentioned group together data-graphics that show the same design approaches. Other methods differentiate design alternatives. The grapheme-property method groups together data-graphics that meet the data-only criterion, except that graphemes may use different properties. For example, data-graphics like the one in Figure 4 would be stored in the same stack regardless of the properties of the circles that were used (e.g. color, shape, size). The grapheme-number method groups data-graphics that have the same types of graphemes, and uses the same properties for each type, in each space. However, the number of each grapheme type in a space may differ. For example, this groups bar charts with one, two, or more bars per axis element in the same stack or maps with points containing a single label or multiple labels in the same stack. Finally, other methods are possible that group graphics based on styles of design (e.g. aligned charts, clustered graphemes, networks, tables, etc.).
We are exploring the different possibilities of providing these methods as individual options or combined sequentially to form a hierarchical classification of graphics within each stack. Our current implementation groups data-graphics using a four-tier hierarchy, consisting of the data-only (bottom), space-order, grapheme-property, and grapheme-number (top) categorization methods. Expanding a stack is equivalent to removing a constraint for that particular stack so that members of the stack can be viewed in greater detail. A stack can be expanded into a series of stacks which can be further expanded until the bottom of the hierarchy is reached.
The existence of similarity search strategies opens up the possibility that some of the data-graphics retrieved by SageBook may not fully conform to what the user desires. In such cases our system provides manual adaptation capabilities through SageBrush and automatic adaptation capabilities through SageBook.
The automatic-adaptation module does the mapping between data-domains in the query to data-domains in the retrieved data-graphic based on their characteristics. When there are data-domains in the retrieved data-graphic that cannot be mapped to domains in the query, the adaptation module will discard graphical objects from the data-graphic as necessary. When it is forced to do this, the adaptation module tries to preserve spaces first, graphemes second and grapheme properties last.
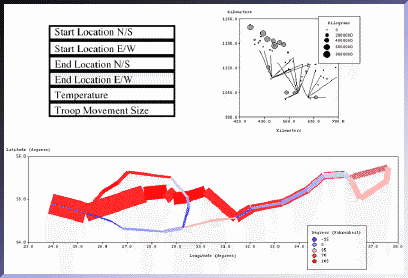
Figure 9 (Top) shows a data-query and an example data-graphic that is retrieved by that query. This data-graphic shows a supply-network with supply routes/paths (indicated by the lines) and demand units (indicated by the marks). The data-graphic was retrieved because it contains "paths" which are defined by the geographic coordinates of their end-points. This exactly matches with the data-domains start-location-n/s, start-location-e/w, end-location-n/sand end-location-e/w in the query data.
Figure 9 (Bottom) shows the new data-graphic that is generated from the query data after automatic adaptation has been performed on the data-graphic in Figure 9 (Top). Note that the marks in Figure 9 (Top) were discarded in Figure 9 (Bottom) because the old domains which it expressed (geographic location of demand units and the quantity required by those units) could not be mapped to any of the new domains in the query (i.e. temperature and troop-movement-size). This is because temperature and troop-movement-size are properties of the "paths", whereas the demand units are totally separate objects.
When there are additional data-domains in the query data that cannot be mapped to the retrieved data-graphic, the adaptation module leaves it to SAGE to add them into the new data-graphic. In the example adaptation shown in Figure 9, SAGE additionally encoded temperature by using color and troop-movement-size by line thickness. In general, we have developed and equipped SAGE with knowledge-based design techniques that can complete partial design specifications [8]. Partial specifications may be constructed either by SageBook's automatic adaptation module or by the user. We have explained how Figure 9 (Bottom) can be constructed automatically through SageBook; [7] shows how it can be constructed by the user through SageBrush.
We have designed and implemented a content-based search system, SageBook, which provides users with design expertise by giving them access to a database of prior data-graphics. Unlike prior image-retrieval systems, the goal of SageBook is to provide content-based retrieval facilities in the context of supporting data-graphic design. In order to fulfill this goal:
1. Borgman, C.L., Belkin, N.J., Croft, W.B., Lesk, M.E., and Landauer, T.K. Retrieval Systems for the Information Seeker: Can the Role of the Intermediary be Automated? CHI'88 Human Factors in Computing Systems, ACM, April 1988, p.51-53.
2. Garber, S.R. and Grunes, M. B., The Art of Search: A study of Art Directors. Proceedings CHI'92 Human Factors in Computer Systems, ACM, May 1992,p.157-163.
3. Kato, T., Kurita, T., and Shimogaki, H., Multimedia Interaction with Image Database Systems. SIGCHI Bulletin 22, 1 (July, 1990), p. 52-54.
4. Mackinlay, J.D. Automating the Design of Graphical Presentations of Relational Information. ACM Transactions on Graphics, 5, 2 (Apr 1986),p.110-141.
5. Myers, B., Goldstein J., Goldberg, M.A. Creating Charts by Demonstration. Proceedings CHI'94 Human Factors in Computing Systems, ACM, April 1994, p.106-111.
6. Nishiyama H., Kin, S., Yokoyama, T. and Matsushita Y. An Image Retrieval System Considering Subjective Perception. Proceedings CHI'94 Human Factors in Computing Systems, ACM, April 1994, p.30-36.
7. Roth, S.F., Kolojejchick J., Mattis J., Chuah M., SageTools: An Intelligent Environment for Sketching, Browsing, and Customizing Data-Graphics. Proceedings CHI'95 Human Factors in Computing Systems, ACM, May 1995.
8. Roth, S.F., Kolojejchick J., Mattis J., Goldstein J., Interactive Graphic Design Using Automatic Presentation Knowledge. Proceedings CHI'94 Human Factors in Computing Systems, ACM, April 1994,p.112-117.
9. Roth, S.F. and Mattis J. Data Characterization for Intelligent Graphics Presentation. Proceedings SIGCHI'90 Human Factors in Computing Systems, Seattle, WA, ACM, April, 1990, p. 193-200.
10. Tou, F. N., Williams, M.D.Fikes R., Henderson, A., & Malone, T. RABBIT:An Intelligent Database Assistant. AAAI-82 Proceedings of the National Conference on Artificial Intelligence, 1, August. 1980, p.314-318.

Sean Cier (scier@cmu.edu)
Last update: 4 December 1995