RESEARCH
SAMPLES
SAGE
PAPERS
PEOPLE
HOME

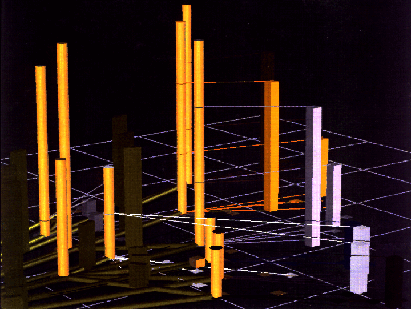
(Figure generated by SAGE.)
The full impact of applying AI techniques to automate the process of designing graphics will be realized when SAGE
can support 3D visualization. As these graphics illustrate, we are exploring 3D approaches to represent this knowledge
both for 3D graphics drawn in perspective and using binocular, stereoscopic display technology.

These pictures are snapshots of a 3D environment in which planners can interactively explore supply networks and
inventory requirements for distribution areas. The green pipes along the surface plane represent main transportation
routes (MSR). The green rectangles emanating from the center of each MSR can convey its capacity, quantities o
materials currently flowing along it, demand or other quantitative characteristics. The MSRs connect supply points
(yellow cylinders), whose heights also convey relevant quantities (e.g. the total requirements for distribution areas
expected to obtain materials from it). Distribution areas are represented as rectangles whose heights convey material
requirements. A thin line connects each distribution area to the supply point which provide its materials.
Go back to Samples page.

