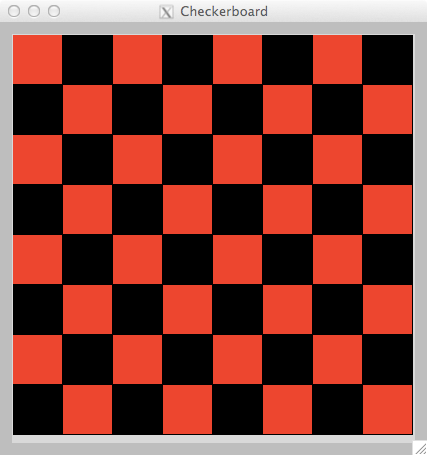
[2 points] In the file checkerboard.py, write a function checkerboard() that draws a standard 8 X 8 checkboard on a canvas of size 400 X 400. Squares alternate red and black on the first row, then alternate black and red on the second row, then alternate red and black on the third row, and so on. Each square should be the same size and the board should fill up the canvas. You will only get full credit if you can write this function using a nested loop and NO if statements. Look for patterns.
HINT: You might want to store the colors in a list, noting that their indices would be 0 and 1, respectively. The modulo operation will probably be helpful here.
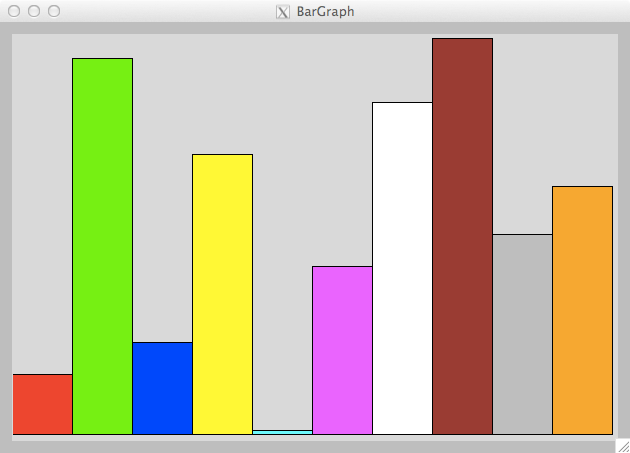
[3 points] In the file bargraph.py, write a function bargraph(datalist) that takes a list of 10 data values and displays a bar graph of these data values. The bar graph should be displayed in a canvas of size 600 X 400, and each bar should have an equal width. The bottom of each bar must be anchored at the bottom of the canvas, and the height of the bar must be proportional to the data value being displayed, with the maximum height representing 100. Each of the data values is guaranteed to be in the range 1 to 100 inclusive. Each bar should have a different color of your choosing, and these colors should be stored in a list so you can write a compact function.
Here is a sample output for the following list:
datalist = [15, 94, 23, 70, 1, 42, 83, 99, 50, 62]
[3 points] In the file rollthedice.py, write a function roll() that displays five die, each showing a random number between 1 and 6, inclusive. See the example below. The canvas should be 500 X 100, and each die will occupy 100 X 100 of the canvas.

In order to draw the dice, you should write six helper functions, one for each die value, that draws 1 to 6 dots (circles), relative to a top left starting point (x,y) supplied as parameters. Remember that the helper functions need to be written in your file before the function that calls them.
Each die should be 100 X 100. You may determine how big the dots on the die are, but the dots should be lined up as a standard die would be. Then your roll function would initialize a canvas, generate five random numbers between 1 and 6, inclusive, and draw a die for each random number by drawing a white square at the appropriate position and then calling the respective helper function(s) with an appropriate top left position for x and y.