Lab Week 03 - Fall 2023
Tuesday, September 12, 2023
Introduction
Remember: As you work on these steps with guidance from your teaching assistant, you should look toward your neighbor to see if they need help (or ask if you need help). You can collaborate in lab during these activities!
In this lab, you will
- Practice programming with mouse interaction.
- Implement some solutions that use the conditional if and if/else statements.
Create a folder for this lab in your 15-104 folder/directory..
- Inside your 15-104 folder on your computer, create a new folder named lab-03.
- Now let’s try a few programming problems. Don’t worry if you don’t get all of them done. Try as many as you can. As you start each problem, download a copy of the zipped template2023-p5only.zip file, unzip the template and move the template-p5only folder into lab-03 and rename it using the letter of the problem, e.g. andrewID-03-A, andrewID-03-B, etc.
- For each problem, you will edit the sketch.js file to accomplish the task and then double-click on the associated index.html file to see the results. Your TA will pause the lab approximately every 15 minutes to discuss a sample solution in case you get stuck.
Problem A: Gradient
Write a p5.js program that sets the background of a 256 X 256 canvas to a shade of gray (from black to white) based on the x and y position of the mouse, whichever is greater. For example, if the mouse is at position (214, 119), then the background should be set to gray level 214.
To verify this is working correctly, print the gray value used for the background to the Console and view this in the browser as you run the program.
Problem B: Traffic Light
Write a p5.js program that draws and simulates a standard traffic light. The canvas is 300 X 400. The light initially displays as green. If the user clicks the mouse, the light should change to yellow. Another click will turn the light red. Another click will turn the light back to green. This cycle should continue with additional clicks.
Here is some code for the basic traffic light to start your draw function (copy it and put it inside your draw function):
// Draws the basic image of a blank traffic light
fill(255, 215, 0);
stroke(0);
rect(100, 50, 100, 100);
triangle(50, 50, 100, 50, 100, 150);
triangle(200, 50, 250, 50, 200, 150);
rect(100, 150, 100, 100);
triangle(50, 150, 100, 150, 100, 250);
triangle(200, 150, 250, 150, 200, 250);
rect(100, 250, 100, 100);
triangle(50, 250, 100, 250, 100, 350);
triangle(200, 250, 250, 250, 200, 350);
fill(64);
ellipse(150, 100, 80, 80);
ellipse(150, 200, 80, 80);
ellipse(150, 300, 80, 80);
You will need to add a little more code to draw a red, yellow or green circle after the basic traffic light is drawn. You will also need to write a mousePressed function to change the state of the light each time the mouse is clicked. Then in the rest of your draw function, use if and else to draw the appropriate color circle in the correct location based on the state of the traffic light.
HINT: You should use a global variable to keep track of the current state of the light. For example, set the variable to 1 to represent green, 2 for yellow and 3 for red. Modify this value stored in this variable in the mousePressed function.
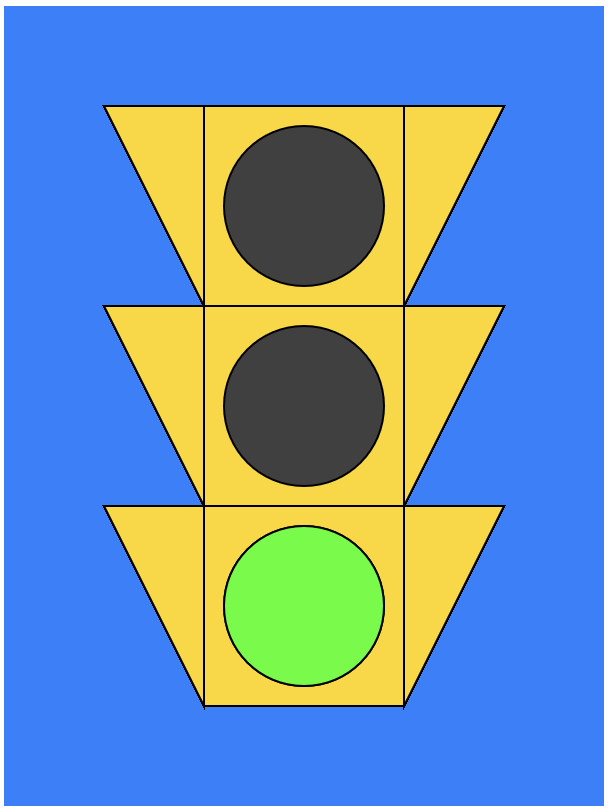
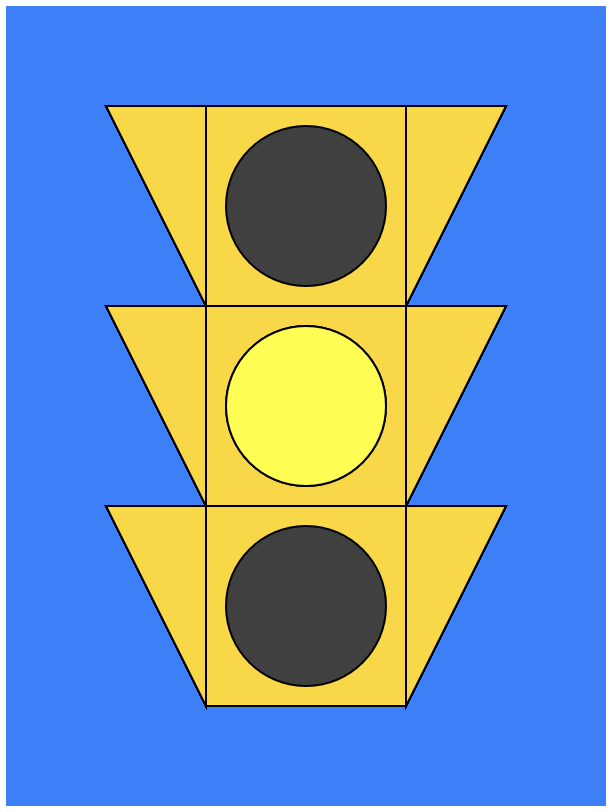
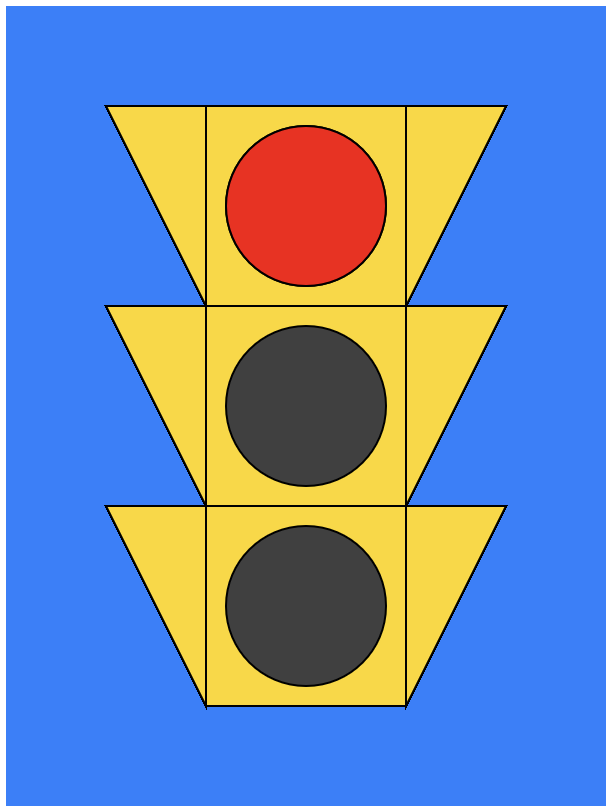
Three snapshots of the application running, showing each phase of the traffic light.
Problem C: Random Circles
Write a p5.js program that creates a white canvas of size 400 x 400 and draws 64 random circles as shown below (8 rows of 8 circles per row). Each circle should be a random color chosen between red, green and blue with equal probability. Once your canvas is full, your program should stop.
HINT: This is similar to the Random Lines program we did in class. For those of you who have programmed already, you do NOT need to use loops here.
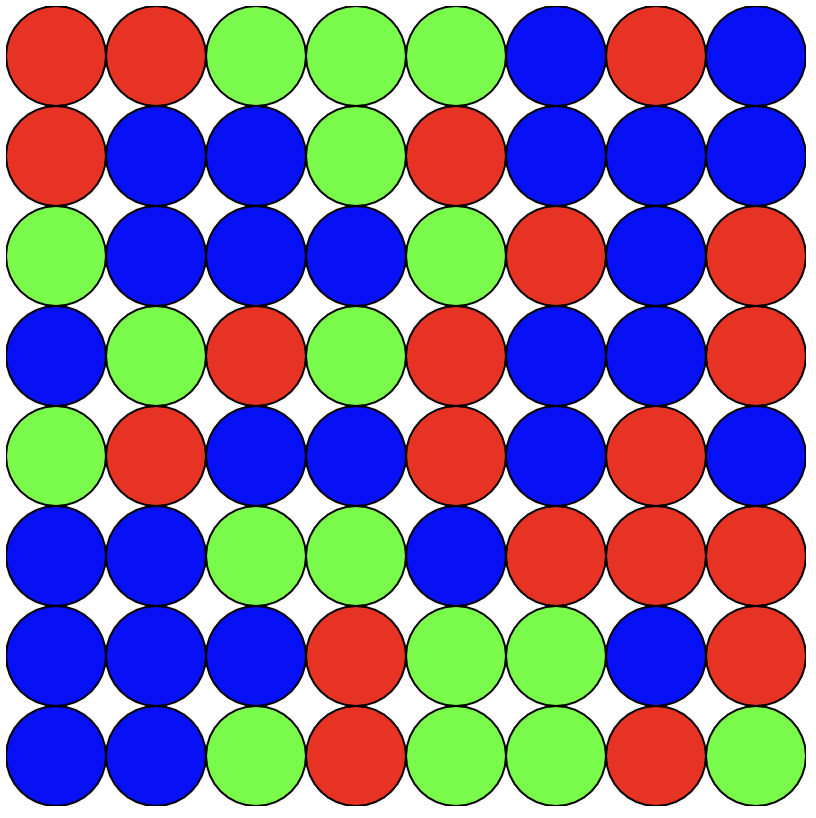
Your program will generate a different random patterns of circles, but the overall number of each color should be reasonably balanced over multiple runs of the program.
Problem D: Perimeter
Write a p5.js program that has a 50 X 50 magenta square move along the border of a canvas of arbitrary size across the top from left to right, then down the right side from top to bottom, then across the bottom from right to left, then up the left side from bottom to top, and then repeat. This is trickier than it seems!
You may want to define global variables to keep track of the x, y position of the square and the direction of movement (+1, 0, or -1) for each dimension.
The picture below shows the general idea. The yellow arrows are only there to give you the sense of the movement. Do not draw the arrows!
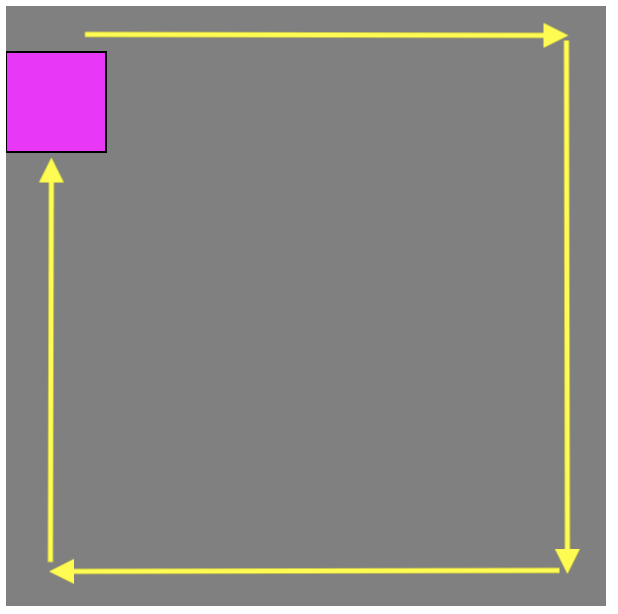
Arrows show the movement of the square, but you should not draw the arrows.
Once you run out of time, you should submit your completed work for credit.
-
Assuming you completed all four problems, your lab-03 folder should look something like this in terms of its organization (indentation indicates a subfolder or its contents):
      lab-03
          andrewID-03-A
              index.html
              sketch.js
          andrewID-03-B
              index.html
              sketch.js
          andrewID-03-C
              index.html
              sketch.js
          andrewID-03-D
              index.html
              sketch.js
-
Compress your lab-03 folder into a zip file. Go to the lab-03 folder and right click and select the option to either compress or zip the contents of the folder. You should see a lab-03.zip file appear along with the lab subfolder in the 15-104 folder:
      lab-03
          andrewID-03-A
              index.html
              sketch.js
          andrewID-03-B
              index.html
              sketch.js
          andrewID-03-C
              index.html
              sketch.js
          andrewID-03-D
              index.html
              sketch.js
      lab-03.zip
-
Hand in the lab-03.zip file to Autolab.
- Go to autolab.andrew.cmu.edu and log in.
- You should see 15-104 as your course. Click on that course. (If you don't see the course, let your TA know.)
- Select the Lab 03 assessment and drag the lab-03.zip file into designated drop off area. Click the checkbox that indicates you are abiding by the Academic Integrity policy for the course. (You can collaborate for labs.)
- Click SUBMIT to upload your file to us.