- Important Notes [Pre-reading]
- We will only run graphics in Standard Python.
These examples will not run in Brython.
- The standard Python documentation for tkinter can be hard to read.
You can find our preferred documentation here (see chapter 8 on 'The Canvas Widget').
- To run these examples, first download
cmu_112_graphics.py
and be sure it is in the same folder as the file you are running.
- That file has version numbers. As we release updates,
be sure you are using the most-recent version!
- Some prior semesters use a slightly different framework. Be aware of this if you
are reviewing previous semesters' materials, especially prior to F19!
- The videos are still from a prior semester, so you may notice a change in the names of the functions used in the videos, but they serve the same purpose. Also, we now use the app.width and app.height properties to get canvas dimensions (instead of just width and height as function arguments)
- Installing Required Modules (PIL/Pillow and Requests) [Pre-reading]
To use all of the features of cmu_112_graphics.py, you need
to have some modules installed. You don't absolutely need to have them installed to do basic graphics
and animations so we have some time to help you with any issues, but if they are not installed, you will see
a message like this (or a similar one for 'requests' instead of 'PIL'):
**********************************************************
** Cannot import PIL -- it seems you need to install pillow
** This may result in limited functionality or even a runtime error.
**********************************************************
You can try to use 'pip' to install the missing modules, but it can be
complicated making sure you are installing these modules for the same version
of Python that you are running. Here are some more-reliable steps
that should work for you:
Important Hint: in the steps below, you will
use the terminal (on Mac) or command prompt (on Windows). In each case, this is not the
terminal in VS Code!
- To get a Command Prompt
on Windows, hit the Windows key, and then type
in 'command' (or just 'cmd').
-
To get a Terminal
on a Mac, click on the Spotlight Search and
type in 'terminal'.
With that, here are the steps:
- For Windows:
- Run this Python code block in your main Python file (it will print the commands you need to paste into your command prompt):
import sys
print(f"'{sys.executable}' -m pip install pillow")
print(f"'{sys.executable}' -m pip install requests")
- Open Command Prompt as an administrator user (right click - run as administrator)
- Copy-paste each of the two commands printed in step 1 into the
command prompt you opened in step 2.
- Close the command prompt and close Python.
- Re-open Python, and you're set (hopefully)!
- For Mac or Linux:
- Run this Python code block in your main Python file (it will print the commands you need to paste into your command prompt):
import sys
print(f"sudo '{sys.executable}' -m pip install pillow")
print(f"sudo '{sys.executable}' -m pip install requests")
- Open Terminal
- Copy-paste each of the two commands printed in step 1 into the
command prompt you opened in step 2.
- If you see a lock and a password is requested, type in the same password that you use to log into your computer.
- Close the terminal and close Python.
- Re-open Python, and you're set (hopefully)!
Quick test
- Create a new folder on your computer for week 3 (if you haven't already).
- Download both cmu_112_graphics.py and helloGraphics.py [UPDATED] and save them in your week 3 folder.
- In VS Code, open the helloGraphics.py file in your week 3 folder and run it with ctrl+b or cmd+b.
- A window with graphics should pop up. We'll ask you about this in the pre-reading checkpoint, so make sure you know exactly what this window looks like.
If these steps do not work for you, please go to OH and we will be happy
to assist.
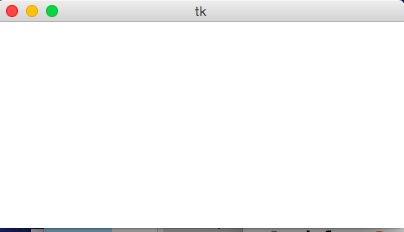
- Create an Empty Canvas
from cmu_112_graphics import *
def redrawAll(app, canvas):
pass # replace with your drawing code!
runApp(width=400, height=200)
Result:
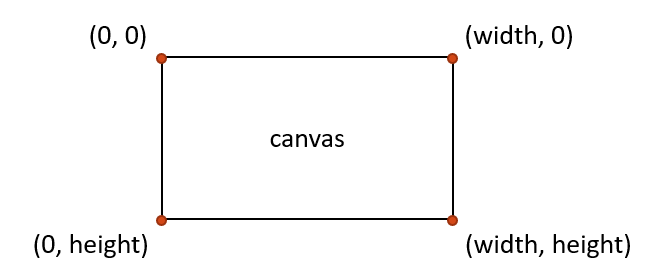
- Canvas Coordinates
Note: unlike in math,
the y axis grows down instead of up. Thus, (0, 0) is at the top left corner of the canvas.
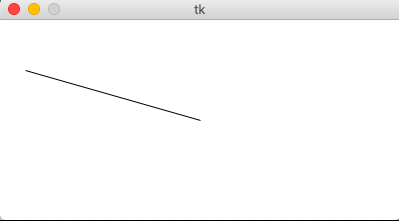
- Draw a Line
from cmu_112_graphics import *
def redrawAll(app, canvas):
# create_line(x1, y1, x2, y2, fill='black')
# draws a black line from (x1, y1) to (x2, y2)
canvas.create_line(25, 50, app.width/2, app.height/2, fill='black')
runApp(width=400, height=200)
Result:
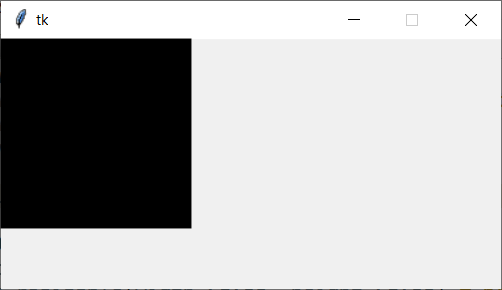
- Draw a Rectangle with create_rectangle(left, top, right, bottom)
from cmu_112_graphics import *
def redrawAll(app, canvas):
# The first four parameters are the upper-left (x,y)
# and the lower-right (x,y) of the rectangle
canvas.create_rectangle(0, 0, 150, 150, fill='black')
runApp(width=400, height=200)
Result:
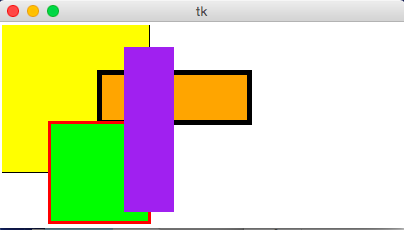
- Graphics Parameters
from cmu_112_graphics import *
def redrawAll(app, canvas):
# most graphics functions allow you to use optional parameters
# to change the appearance of the object. These are written with the code
# paramName=paramValue
# after the core parameters in the code
# fill changes the internal color of the shape
canvas.create_rectangle( 0, 0, 150, 150, fill='yellow', outline='black')
# width changes the size of the border
canvas.create_rectangle(100, 50, 250, 100, fill='orange',
outline='black', width=5)
# outline changes the color of the border
canvas.create_rectangle( 50, 100, 150, 200, fill='green',
outline='red', width=3)
# width=0 removes the border entirely
canvas.create_rectangle(125, 25, 175, 190, fill='purple', width=0)
runApp(width=400, height=200)
Result:
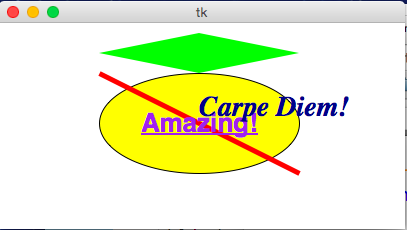
- Draw Other Shapes and Text
from cmu_112_graphics import *
def redrawAll(app, canvas):
# ovals provide the coordinates of the bounding box
canvas.create_oval(100, 50, 300, 150, fill='yellow', outline='black')
# polygons and lines provide the (x,y) coordinates of each point
# polygons must have 3+ points; lines must have 2+
canvas.create_polygon(100,30,200,50,300,30,200,10, fill='green')
canvas.create_line(100, 50, 300, 150, fill='red', width=5)
# text provides a single (x,y) point, then anchors the text there
# text also requires the text, and can have a font
canvas.create_text(200, 100, text='Amazing!',
fill='purple', font='Helvetica 26 bold underline')
canvas.create_text(200, 100, text='Carpe Diem!', anchor='sw',
fill='darkBlue', font='Times 28 bold italic')
runApp(width=400, height=200)
Result:
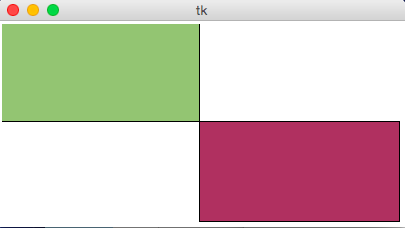
- Draw Custom Colors
from cmu_112_graphics import *
def rgbString(r, g, b):
# Don't worry about the :02x part, but for the curious,
# it says to use hex (base 16) with two digits.
return f'#{r:02x}{g:02x}{b:02x}'
def redrawAll(app, canvas):
pistachio = rgbString(147, 197, 114)
maroon = rgbString(176, 48, 96)
canvas.create_rectangle(0, 0, app.width/2, app.height/2,
fill=pistachio, outline='black')
canvas.create_rectangle(app.width/2, app.height/2, app.width, app.height,
fill=maroon, outline='black')
runApp(width=400, height=200)
Result:
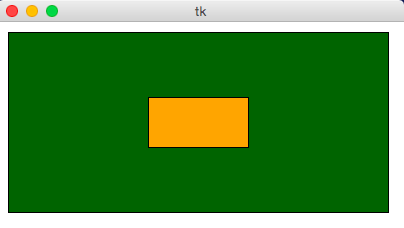
- Draw Centered Shapes
from cmu_112_graphics import *
def redrawAll(app, canvas):
margin = 10
# Approach #1: Add margin to top/left, subtract margin from bottom/right:
canvas.create_rectangle(margin, margin, app.width-margin, app.height-margin,
fill='darkGreen', outline='black')
# Approach #2: add/subtract app.width/app.height from center (cx, cy)
(cx, cy) = (app.width/2, app.height/2)
(rectWidth, rectHeight) = (app.width/4, app.height/4)
canvas.create_rectangle(cx - rectWidth/2, cy - rectHeight/2,
cx + rectWidth/2, cy + rectHeight/2,
fill='orange', outline='black')
runApp(width=400, height=200)
Result:
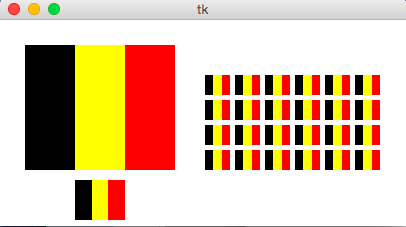
- Graphics Helper Functions
from cmu_112_graphics import *
def drawBelgianFlag(canvas, x0, y0, x1, y1):
# draw a Belgian flag in the area bounded by (x0,y0) in
# the top-left and (x1,y1) in the bottom-right
width = (x1 - x0)
canvas.create_rectangle(x0, y0, x0+width/3, y1, fill='black', width=0)
canvas.create_rectangle(x0+width/3, y0, x0+width*2/3, y1,
fill='yellow', width=0)
canvas.create_rectangle(x0+width*2/3, y0, x1, y1, fill='red', width=0)
def redrawAll(app, canvas):
# Draw a large Belgian flag
drawBelgianFlag(canvas, 25, 25, 175, 150)
# And draw a smaller one below it
drawBelgianFlag(canvas, 75, 160, 125, 200)
# Now let's have some fun and draw a whole grid of Belgian flags!
flagWidth = 30
flagHeight = 25
margin = 5
for row in range(4):
for col in range(6):
left = 200 + col * flagWidth + margin
top = 50 + row * flagHeight + margin
right = left + flagWidth - margin
bottom = top + flagHeight - margin
drawBelgianFlag(canvas, left, top, right, bottom)
runApp(width=400, height=200)
Result:
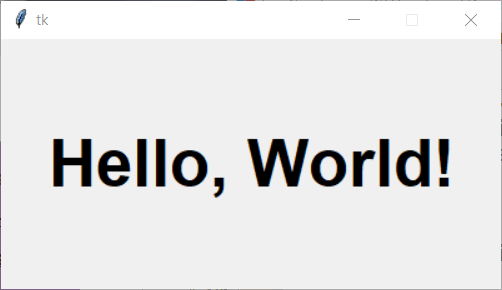
- Dynamically sizing text
from cmu_112_graphics import *
def redrawAll(app, canvas):
# Dynamically sizing text is harder, but possible!
# Just compute the font size based on the width or height
# Some guesswork helps to get the ratio right
textSize = app.width // 10
canvas.create_text(app.width/2, app.height/2, text='Hello, World!',
font=f'Arial {textSize} bold', fill='black')
runApp(width=400, height=400)
Result:
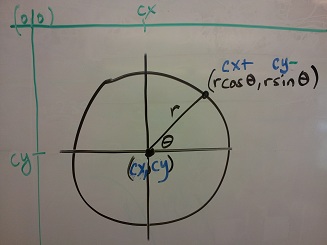
- Trigonometry 101 [Pre-reading]
- Circle centered at origin

- Circle centered at (cx, cy)
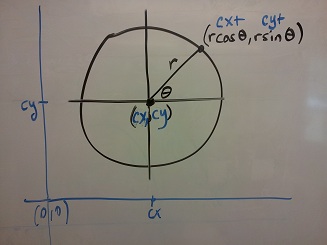
- Circle centered at (cx, cy) in Python graphics ('up is down!')
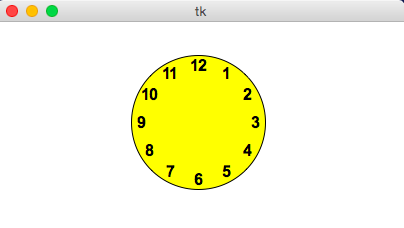
- Drawing Circular Patterns with Trigonometry
from cmu_112_graphics import *
import math
def redrawAll(app, canvas):
(cx, cy, r) = (app.width/2, app.height/2, min(app.width, app.height)/3)
canvas.create_oval(cx-r, cy-r, cx+r, cy+r, fill='yellow', outline='black')
r *= 0.85 # make smaller so time labels lie inside clock face
for hour in range(12):
hourAngle = math.pi/2 - (2*math.pi)*(hour/12)
hourX = cx + r * math.cos(hourAngle)
hourY = cy - r * math.sin(hourAngle)
label = str(hour if (hour > 0) else 12)
canvas.create_text(hourX, hourY, text=label,
font='Arial 16 bold', fill='black')
runApp(width=400, height=400)
Result:
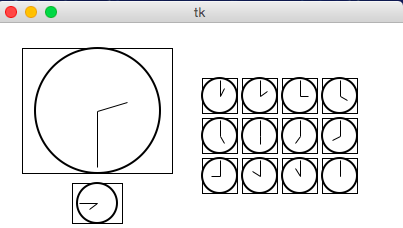
- Example: Clocks!
from cmu_112_graphics import *
import math
def drawClock(canvas, x0, y0, x1, y1, hour, minute):
# draw a clock in the area bounded by (x0,y0) in
# the top-left and (x1,y1) in the bottom-right
# with the given time
# draw an outline rectangle
canvas.create_rectangle(x0, y0, x1, y1, outline='black', width=1)
# find relevant values for positioning clock
width = (x1 - x0)
height = (y1 - y0)
r = min(width, height)/2
cx = (x0 + x1)/2
cy = (y0 + y1)/2
# draw the clock face
canvas.create_oval(cx-r, cy-r, cx+r, cy+r, outline='black', width=2)
# adjust the hour to take the minutes into account
hour += minute/60.0
# find the hourAngle and draw the hour hand
# but we must adjust because 0 is vertical and
# it proceeds clockwise, not counter-clockwise!
hourAngle = math.pi/2 - 2*math.pi*hour/12
hourRadius = r*1/2
hourX = cx + hourRadius * math.cos(hourAngle)
hourY = cy - hourRadius * math.sin(hourAngle)
canvas.create_line(cx, cy, hourX, hourY, fill='black', width=1)
# repeat with the minuteAngle for the minuteHand
minuteAngle = math.pi/2 - 2*math.pi*minute/60
minuteRadius = r*9/10
minuteX = cx + minuteRadius * math.cos(minuteAngle)
minuteY = cy - minuteRadius * math.sin(minuteAngle)
canvas.create_line(cx, cy, minuteX, minuteY, fill='black', width=1)
def redrawAll(app, canvas):
# Draw a large clock showing 2:30
drawClock(canvas, 25, 25, 175, 150, 2, 30)
# And draw a smaller one below it showing 7:45
drawClock(canvas, 75, 160, 125, 200, 7, 45)
# Now let's have some fun and draw a whole grid of clocks!
width = 40
height = 40
margin = 5
hour = 0
for row in range(3):
for col in range(4):
left = 200 + col * width + margin
top = 50 + row * height + margin
right = left + width - margin
bottom = top + height - margin
hour += 1
drawClock(canvas, left, top, right, bottom, hour, 0)
runApp(width=400, height=400)
Result: