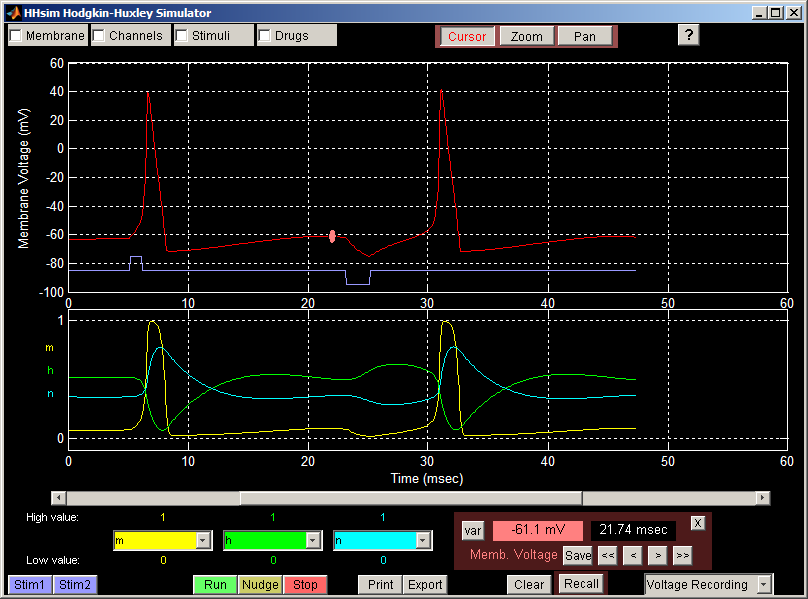

In the figure above, the cursor is measuring the resting potential (red line in the upper plot) just before an inhibitory stimulus was applied. The cursor panel in the lower right indicates that the membrane voltage is -61.1 mV at 21.74 msec from the start of the simulation.
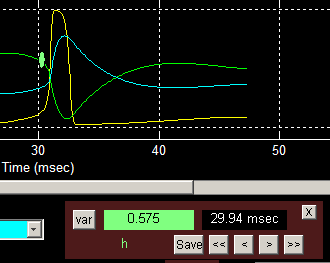
Once the cursor is set at a point, it can be moved left or right using the cursor control buttons in the cursor panel. The < and > buttons nudge the cursor one time-point to the left or right, respectively. The << and >> buttons move the cursor left or right to the nearest local maximum or minimum value. For example, suppose we want to find the greatest amount of closure of the sodium inactivation gate (h) after a spike. Start by clicking on the green line to activate the cursor:

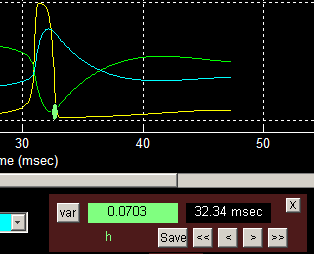
We see that the value of the inactivation gate parameter, h, is 0.575 at 29.94 msec from the start of the simulation. Next, click on the >> button to move the cursor right to the nearest extreme value:

The cursor panel shows that the local minimum value for h is 0.0703, and it occurs at 32.34 msec.
The var button is used to move the cursor vertically from one plot line to another, to change the variable being measured at that point in time. For example, suppose we wanted to know the value of the potassium activation gate (n) at the peak of a spike. To measure this, set the cursor on the red line (membrane voltage) and use the << or >> button to find the peak. Then press the var button until the cursor is on the cyan line (n), and read the value in the cursor panel.
Clicking on the Save button in the cursor panel stores the Hodgkin-Huxley values at the current cursor position. The simulator can later be reset to these values by clicking on the Recall button. This feature is useful for resetting the system to a known resting state after each of a series of manipulations, so that fair comparisons can be made.
Back to the Guide to Using HHsim