y = (x**3 + 2*x) / 3Remember in Python that when you divide one integer by another, you may get a truncation error since you lose the fractional part of the result. For example, 11/3 in Python is 3, not 3.6666666.... You are concerned that you might get a truncation error when it is stored in y, but someone tells you that x3 + 2x is always evenly divisible by 3 when x is positive, so there is never any truncation error. You will use induction to verify this.
-
Show that the Python statement has no truncation error for x = 1.
-
Assume the statement has no truncation error for some integer x ≥ 1.
Show that the statement has no truncation error for x+1. Put another way,
assuming x3 + 2x is evenly divisible by 3 for an integer x ≥
1, show that (x+1)3 + 2(x+1) is also evenly divisible by 3.
HINT: Expand (x+1)3 + 2(x+1) algebraically, extract out x3 + 2x, and look at what is left.
- How do steps (a) and (b) prove that the Python statement computes correctly without truncation error for all integer x ≥ 1?
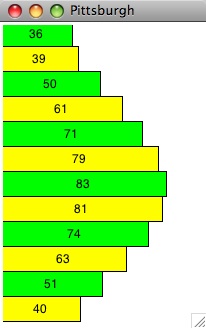
1. Set low = 0.
2. Set high = N-1.
3. Set mid = (low + high) div 2.
4. While low ≤ high and target ≠ A[mid] do the following:
   a. If target < A[mid], set high = mid-1; otherwise, set low = mid+1.
   b. Set mid = (low + high) div 2.
5. If low ≤ high, output mid.
   Otherwise, output -1.
-
Trace this algorithm for the following vector (N=9) and a target value of
73, showing the value of low, high, and mid immediately before the loop
starts and after each iteration of the loop. What is the final value that
is output?
   0    1    2    3    4    5    6    7    8    9   10
 ------------------------------------------------------
| 13 | 29 | 33 | 40 | 58 | 64 | 68 | 73 | 89 | 92 | 99 |
 ------------------------------------------------------
-
Repeat part (a) for a target value of 36.
- If you had 1 billion data values in increasing order and you had to search for a specific target using binary search, approxmiately how many data values do you need to look at in order to determine if the target is present or not? Explain your answer.
- How long would it take to examine 4 objects (i.e. N=4) if your
algorithm requires the following number of steps:
- Algorithm 1: log2N steps
- Algorithm 2: N2 steps
- Algorithm 3: 2N steps
- How many more minutes would be needed to use the same
algorithms above
if you examined four times as many objects (i.e. N=16)?
- Which of the three algorithms would you use on a warehouse of 1 million objects? Explain.
- How many songs are sung in this competition if it starts with 10
contestants? Show your work.
- If there were N contestants in this competition, N > 0, exactly how
many songs are sung in this competition as a function of N?
- Answer part (b) using Big O notation in simplest form. Explain what your big O notation says about this problem.
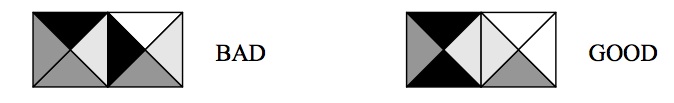
The museum wants to display the canvases in a 4 X 3 grid so that triangular regions of two canvases that are touching have the same color. Here are examples with 2 canvases only:
-
Assuming the museum does not rotate the canvases, how many different
configurations have to be checked in the worst case to see if there is a
possible way to display the artwork? Explain your answer.
- If the museum takes 1 minute to set up one 4 X 3 configuration, how long would it take to check all possible configurations to see if one meets their display criteria? Express your answer in years.

-
Determine if there is a valid coloring for this map using the colors
red, green and yellow. If there is, give the color for each country. If
not, explain why.
- In general, for a map with 13 countries, if each country can be colored with one of three colors, how many possible color assignments are there? NOTE: We're not asking for how many valid assignments there are, only how many total assignments there are.