Point Cloud Forecasting as a Proxy for Occupancy Forecasting

Video Versions of Paper Figures

Figure 1

Historical LiDAR Sweeps Future 4D Occupancy Rendered Point Clouds
t = {-T, ..., 0} t = {1, ..., T} t = {1, ..., T}
Motivation. We focus on the problem of scene perception and forecasting for autonomous systems. As traditional methods rely on costly human annotations, we look towards emerging self-supervisable and scalable tasks such as point cloud forecasting. However, we argue that the formulation of point cloud forecasting unnecessarily focuses on learning the sensor extrinsics and intrinsics as part of predicting future point clouds, whereas the only physical quantity of central importance to autonomous perception is future spacetime 4D occupancy. We recast the task as that of 4D occupancy forecasting and show how using the same data as point cloud forecasting, one can learn a meaningful and generic intermediate quantity -- future spacetime 4D occupancy.

Figure 3

Historical LiDAR Sweeps Future 4D Occupancy Rendered Point Clouds Groundtruth Point Clouds
High-level overview of the proposed approach. Instead of directly predicting future point clouds by observing a set of historical point clouds, we take a geometric perspective on this problem and instead forecast a generic intermediate 3D occupancy-like quantity within a bounded volume. Known sensor extrinsics and intrinsics are an input to our method, which is different from how classical point cloud forecasting is formulated. We argue that this factorization is sensible as an autonomous agent plans its own motion and has access to sensor information. Please refer to our supplement for architectural details.

Figure 6

Groundtruth SPFNet-U S2Net-U Raytracing Ours (Point clouds) Ours (Occupancy)
Qualitative results. We compare the point cloud forecasts of S2Net and SPFNet on the nuScenes dataset with our approach on three different sequences at different time horizon. Our forecasts look significantly crisper than the baselines. This demonstrates the benefit of learning to forecast spacetime 4D occupancy with sensor intrinsics and extrinsics factored out. We also visualize the forecasted 4D occupancy at the corresponding future timestamps. We visualize a render of this learnt occupancy and the color encodes height along the z-axis. In these videos, notice how the static scene geometry warps over time in the predictions of S2Net and SPFNet, but is preserved in our forecasts.

Figure 1 (supplement)

Groundtruth SPFNet-M S2Net-M Raytracing Ours (Point clouds) Ours (Occupancy)
We plot the above results again but with points from S2Net and SPFNet below a recommended mask threshold of 0.05 filtered out. This corresponds to the third and fourth rows in Table 1 in the main draft. Notice that most of the high confidence points for both methods lie close to the ego-vehicle and on the ground plane.

Figure 2 (supplement)

Groundtruth ST3DCNN Raytracing Ours (Point clouds) Ours (Occupancy)
Qualitative results on KITTI-Odometry on three different sequences at different time horizons. We compare the point cloud forecasts of ST3DCNN (retrained for 1s an 3s forecasting) and the ray tracing baseline. We see that this SOTA is qualitatively more geometry-aware than the SOTA on nuScenes. However, our method is still more reflective of the true rigid geometry of the underlying world. We visualize a render of this learnt occupancy and the color encodes height along the z-axis.

Figure 7

Future Occupancy nuScenes LiDAR KITTI LiDAR ArgoVerse2.0 LiDAR
New Intrinsic View Synthesis. We show how to simulate different LiDARs' ray patterns on top of the same learned occupancy grid. In this case, the future occupancy is predicted with historic LiDAR data scanned by nuScenes LiDAR, which is a Velodyne HDL32E. First, we show the rendered point cloud under the native setting (nuscenes LiDAR). Then, we show the rendered point cloud for KITTI LiDAR, which is a Velodyne HDL64E and has 2x as many beams than the previous one. Finally, we have the rendered point cloud for ArgoVerse2.0 LiDAR, which consists of 2 VLP-32C stacked on top of each other. The fact that we can forecast occupancy on top of data captured by one type of sensor and use it to simulate future data for different sensors shows the benefits of factoring out sensor intrinsics. This also highlights the generalization capability of the forecasted occupancy.

Figure 8

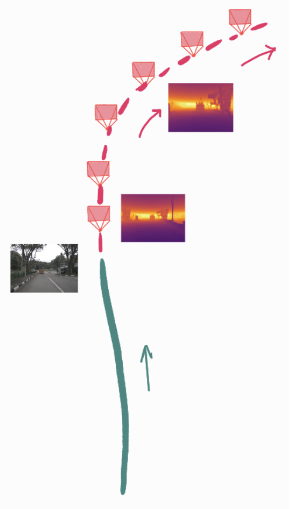
Reference RGB frame at t = 0s Novel-view Depth Synthesis
New Extrinsic View Synthesis. Dense depth maps rendered from the predicted future 4D occupancy from novel viewpoints. To render these depth maps, we take a novel future trajectory of the egovehicle. Placing the camera at each of these locations, always facing forward into the voxel grid (shown in the future dotted red trajectory on the left), gives us a camera coordinate system in which we can shoot rays from the camera center to every pixel in the image, and further beyond into the 4D occupancy volume. Every pixel represents the expected depth along its ray. The RGB image at t=0s is shown as reference and is not used in this rendering. For the depth maps, darker is closer, brighter is farther. Depth on sky regions is untrustworthy as no returns are received for this region from the LiDAR sensor.