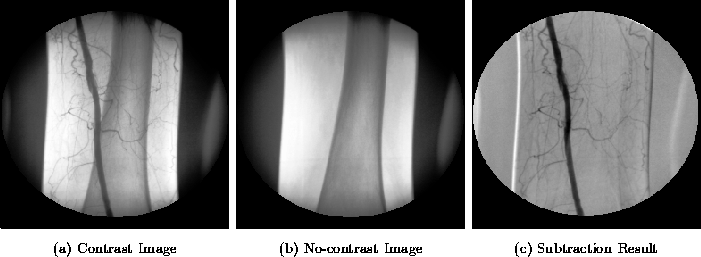
Figure 1: Example angiograms, and a subtraction result.

Figure 1: Example angiograms, and a subtraction result.
The input to the system is an angiogram x-ray, as shown in Figure 1a. Such an image is called a contrast image, because it shows the vessel with the contrast agent injected. Optionally, a second x-ray taken without the contrast agent may be provided, as in Figure 1b. If both images are provided, subtracting them can remove parts of the background that might confuse subsequent detection steps, as shown in Figure 1c. Before subtracting, the images must be aligned to compensate for the any motion of the patient. The alignment algorithm translates and rotates the images to reduce the sum of squared differences in the pixel values, while ignoring pixels which are parts of vessels.
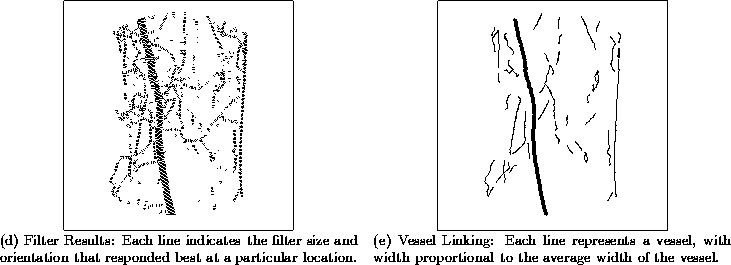
Using either an angiogram or a subtracted image as input, the algorithm applies a series of matched filters to the image. Extending the work of [1], the filters in this algorithm are tuned to detect edges of vessels of specific sizes and orientations. The filter profiles have the same shape as an idealized vessel edge. To determine whether a vessel of a specific size and orientation exists at some point in the image, matched filters for the two edges of a vessel are applied. The edge filter with the minimum response is recorded, insuring that spurious edges are ignored. All sizes and orientations of filters are applied everywhere in the image, with the result shown in Figure 2a.

Figure 2: Filtering results and vessel linking.
After filtering the image, the next step is to link pixels together to form vessels. The linking process is performed using a best-first graph search technique [2], in which the nodes of the graph are pixels, and the edges connect adjacent pixels. The heuristic function guiding the search favors adding pixels which most closely match the vessel found so far in terms of width and orientation, with the result shown in Figure 2b.