 |
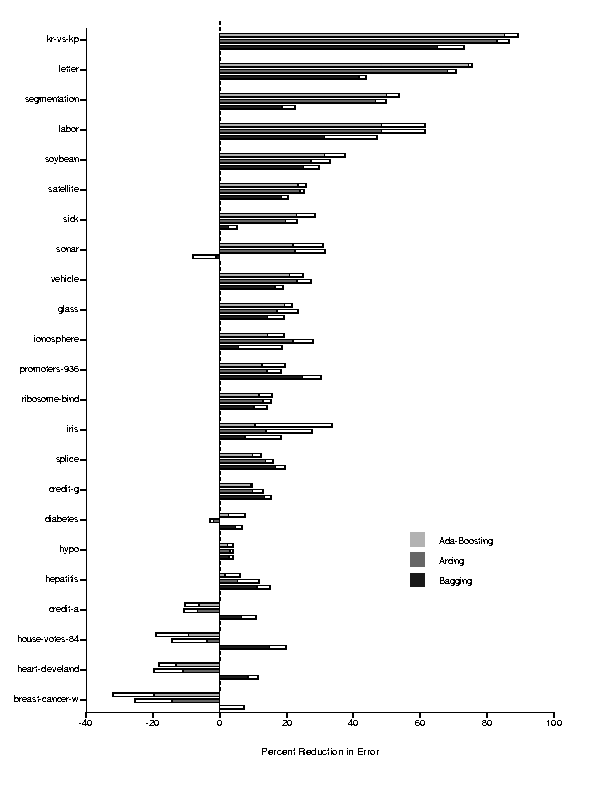
Table 2 shows test-set error rates for the data sets described in Table 1 for five neural network methods and four decision tree methods. (In Tables 4 and 5 we show these error rates as well as the standard deviation for each of these values.) Along with the test-set errors for Bagging, Arcing, and Ada-boosting, we include the test-set error rate for a single neural-network and a single decision-tree classifier. We also report results for a simple (baseline) neural-network ensemble approach - creating an ensemble of networks where each network varies only by randomly initializing the weights of the network. We include these results in certain comparisons to demonstrate their similarity to Bagging. One obvious conclusion drawn from the results is that each ensemble method appears to reduce the error rate for almost all of the data sets, and in many cases this reduction is large. In fact, the two-tailed sign test indicates that every ensemble method is significantly better than its single component classifier at the 95% confidence level; however, none of the ensemble methods are significantly better than any other ensemble approach at the 95% confidence level.
 |
To better analyze Table 2's results, Figures 3 and 4 plot the percentage reduction in error for the Ada-Boosting, Arcing, and Bagging method as a function of the original error rate. Examining these figures we note that many of the gains produced by the ensemble methods are much larger than the standard deviation values. In terms of comparisons of different methods, it is apparent from both figures that the Boosting methods (Ada-Boosting and Arcing) are similar in their results, both for neural networks and decision trees. Furthermore, the Ada-Boosting and Arcing methods produce some of the largest reductions in error. On the other hand, while the Bagging method consistently produces reductions in error for almost all of the cases, with neural networks the Boosting methods can sometimes result in an increase in error.
 |
 |
Looking at the ordering of the data sets in the two figures (the results are sorted by the percentage of reduction using the Ada-Boosting method), we note that the data sets for which the ensemble methods seem to work well are somewhat consistent across both neural networks and decision trees. For the few domains which see increases in error, it is difficult to reach strong conclusions since the ensemble methods seem to do well for a large number of domains. One domain on which the Boosting methods do uniformly poorly is the house-votes-84 domain. As we discuss later, there may noise in this domain's examples that causes the Boosting methods significant problems.