NAVIGATION & SENSING Sandstorm | H1ghlander | Navigation & Sensing
Navigation is a repetitive cycle of sensing, planning and action.
Red Team robots estimate position and state by evaluating GPS, inertial measurement and odometry data (Applanix). The vehicles perceive terrain with laser sensors, cameras (SAIC) and radar (Duke, Boeing). A laser scanner and cameras are mounted on a stablizing three-axis gimbal which directs sensors into terrain regions incompletely scanned by fixed sensors. Sensor data is fused into a composite cost model of the terrain in which less navigable areas are assigned higher cost values.
Path candidates are generated and evaluated as s-curved paths with regard to the pre-planned route, the cost model and vehicle dynamics. The curves blend into a smooth line as path tracking commands the vehicle to follow the planned path. Race logic software (Agent-Oriented Software) layers over navigation to set pace and react to contingencies.
Animation & Video
 Sensor Data and Gimbal Pointing
Green fields cover terrain scanned by left and right laser sensors, the red field covers terrain scanned by a central laser sensor. Two purple cubes bound the area at which the gimbal aims its laser line scanner and stereo camera pair to fill holes in the data.
|
 S-curves
The green X farthest from the vehicle marks the next position the vehicle will attempt to gain. Curves represent paths to the target position. Areas marked in green are perceived as negotiable terrain, red is perceived as non-negotiable.
|
 Path Localization
Path traversal costs based on laser sensor data are displayed in blue with lighter shades representing safer routes. The orange line is the vehicle's pre-planned path, the green line is the localized path.
|
 Gimbal Motion |
 Driving |
 Radar Page |

LASAR SENSING
Single-scanner lidar data

Gimbal-mounted long-range laser scanner

Laser sensor positioning

Composite lidar data
Laser sensing, or lidar (light detection and ranging) is the primary method Red Team racers use to perceive terrain. Lidar sensors transmit a stream of laser pulses, then time the reflected signals to measure terrain coordinates. The pulses are swept in line patterns to measure cross-sections of the terrain geometry. Vehicle speed determines the distance between the cross-sections, which determines the line-density of the terrain model.
Each robot employs seven lidar sensors. One is mounted on a gimbal which directs the sensor at regions of terrain incompletely scanned by fixed sensors. This sensor has a sixty degree field of view, a range of one hundred meters, and scans fifty lines per second.
The fixed-position sensors survey a 180 degree field of view, have a forty meter range and scan seventy-five lines per second. Two shoulder-mounted sensors (2) return terrain elevation data. Two central bumper-mounted scanners (3) detect obstacles in the path of the vehicle and are particularly useful for detecting narrow objects such as poles. The left and right bumper-mounted sensors (4) scan vertically to detect road edges.
Output from the gimbal-mounted and two shoulder-mounted sensors is combined into a laser composite cost model of the terrain. For each sensor, every line scan is considered over vehicle-width segments. A datapoint is generated, comprised of the segment centerpoint and a cost value based on the steepness and jaggedness of the segment. A single-sensor map is divided into a grid of twenty-five centimeter cells that store the average cost value and total number of all datapoints within their confines. The individual maps are combined into the composite map, where the ultimate cost for each cell is the weighted average of costs from all three sensors.
Single-scanner lidar data
Gimbal-mounted long-range laser scanner
Laser sensor positioning
Composite lidar data
Each robot employs seven lidar sensors. One is mounted on a gimbal which directs the sensor at regions of terrain incompletely scanned by fixed sensors. This sensor has a sixty degree field of view, a range of one hundred meters, and scans fifty lines per second.
The fixed-position sensors survey a 180 degree field of view, have a forty meter range and scan seventy-five lines per second. Two shoulder-mounted sensors (2) return terrain elevation data. Two central bumper-mounted scanners (3) detect obstacles in the path of the vehicle and are particularly useful for detecting narrow objects such as poles. The left and right bumper-mounted sensors (4) scan vertically to detect road edges.
Output from the gimbal-mounted and two shoulder-mounted sensors is combined into a laser composite cost model of the terrain. For each sensor, every line scan is considered over vehicle-width segments. A datapoint is generated, comprised of the segment centerpoint and a cost value based on the steepness and jaggedness of the segment. A single-sensor map is divided into a grid of twenty-five centimeter cells that store the average cost value and total number of all datapoints within their confines. The individual maps are combined into the composite map, where the ultimate cost for each cell is the weighted average of costs from all three sensors.
RADAR: A Unique Sensing Capability
A Radar system works by sending out radio-waves to a target and measuring the return echo. A radar beam is not as precise as a laser beam; so compared to lidar, our radar system's resolution is not as good. However, the radar does have a longer range than the lidar, allowing us to see and avoid obstacles from farther away. The 77GHz frequency used by our radar allows us to detect metallic as well as non-metallic obstacles. The Radar is not affected by heavy dust or rain, unlike optical sensors.

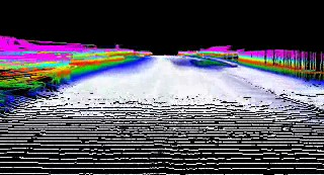
Driving off-road stirs-up clouds of dust, which could interfere with optical sensors
CLUTTER: Finding What's Important and What's Not
One of the main challenges of Radar use is that it is hard to characterize the types of objects seen by the radar. In an off-road environment, the radar frequently sees dirt berms, vegetation, and variations in the road surface as objects, but these objects are not necessarily ŇobstaclesÓ. Objects that appear on the radar, but are un-desired, are called clutter. Clutter reported by the radar to the navigation system, would cause the vehicle to think that there were obstacles present in areas that are actually clear. Forcing the vehicle to slow-down and avoid all of these false objects would impede the progress of the robot, making the robot afraid to drive over areas that are actually clear paths.

The radar (outlined with a blue circle) is mounted up-side down on the front of Sandstorm
Several students from Duke university (under a grant from SAIC) and engineers from Boeing came together with the goal of making the radar a viable sensor for robot navigation. At the time, the radar had potential, but was deemed too unreliable to make a positive contribution to the robot's sensing and navigation. Several filtering and processing techniques were developed and experimented with. Finally, the result was a reliable radar processing system that was intelligent enough for off-road use.
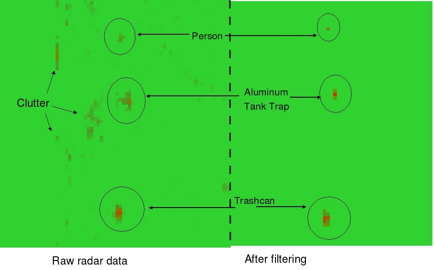
Side-by-Side comparison of raw radar data vs. filtered and processed radar data
A Radar system works by sending out radio-waves to a target and measuring the return echo. A radar beam is not as precise as a laser beam; so compared to lidar, our radar system's resolution is not as good. However, the radar does have a longer range than the lidar, allowing us to see and avoid obstacles from farther away. The 77GHz frequency used by our radar allows us to detect metallic as well as non-metallic obstacles. The Radar is not affected by heavy dust or rain, unlike optical sensors.
Driving off-road stirs-up clouds of dust, which could interfere with optical sensors
CLUTTER: Finding What's Important and What's Not
One of the main challenges of Radar use is that it is hard to characterize the types of objects seen by the radar. In an off-road environment, the radar frequently sees dirt berms, vegetation, and variations in the road surface as objects, but these objects are not necessarily ŇobstaclesÓ. Objects that appear on the radar, but are un-desired, are called clutter. Clutter reported by the radar to the navigation system, would cause the vehicle to think that there were obstacles present in areas that are actually clear. Forcing the vehicle to slow-down and avoid all of these false objects would impede the progress of the robot, making the robot afraid to drive over areas that are actually clear paths.
The radar (outlined with a blue circle) is mounted up-side down on the front of Sandstorm
Several students from Duke university (under a grant from SAIC) and engineers from Boeing came together with the goal of making the radar a viable sensor for robot navigation. At the time, the radar had potential, but was deemed too unreliable to make a positive contribution to the robot's sensing and navigation. Several filtering and processing techniques were developed and experimented with. Finally, the result was a reliable radar processing system that was intelligent enough for off-road use.
Side-by-Side comparison of raw radar data vs. filtered and processed radar data
Below you will find some demonstration videos of the radar in action:
 Driving with radar Sandstorm drives 13 m/s (about 30 MPH) avoiding
obstacles using Radar alone |
 Radar and Lidar Overlay In this video, the obstacles detected by the radar are shown in red, and the obstacles detected by the lidar are shown in blue. Notice that the radar can see objects from much farther away than the lidar. Many more blue-dots appear than red-dots because the lidar reports all objects as they are seen, especially areas of vegetation near the robot; but the radar's heavy filtering prevents allows it to ignore these areas. |
