The system was tested on three large sets of images, which are
completely distinct from the training sets. Test Set A was collected
at CMU, and consists of 42 scanned photographs, newspaper pictures,
images collected from the World Wide Web, and digitized television
pictures. These images contain 169 frontal views of faces, and
require the networks to examine 22,053,124 20x20 pixel windows. Test
Set B consists of 23 images containing 155 faces (9,678,084 windows);
it was used in [7] to measure the accuracy of their system.
Test Set C is similar to Test Set A, but contains many images with
more complex backgrounds and without any faces, to more accurately
measure the false detection rate. It contains 65 images, 183 faces,
and 51,368,003 windows.![]()
A feature our face detection system has in common with many systems is that the outputs are not binary. The neural network filters produce real values between 1 and -1, indicating whether or not the input contains a face, respectively. A threshold value of zero is used during training to select the negative examples (if the network outputs a value of greater than zero for any input from a scenery image, it is considered a mistake). Although this value is intuitively reasonable, by changing this value during testing, we can vary how conservative the system is. To examine the effect of this threshold value during testing, we measured the detection and false positive rates as the threshold was varied from 1 to -1. At a threshold of 1, the false detection rate is zero, but no faces are detected. As the threshold is decreased, the number of correct detections will increase, but so will the number of false detections. This tradeoff is illustrated in Figure 10, which shows the detection rate plotted against the number of false positives as the threshold is varied, for the two networks presented in the previous section. Since the zero threshold locations are close to the ``knees'' of the curves, as can be seen from the figure, we used a zero threshold value throughout testing. Experiments are currently underway to examine the effect of the threshold value used during training.
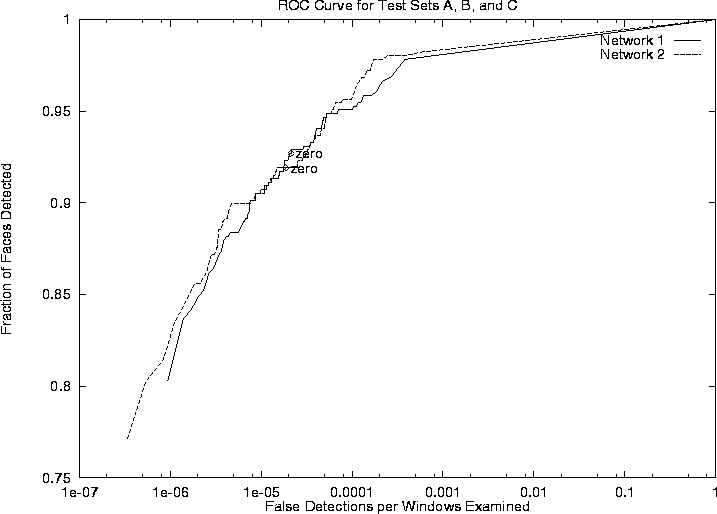
Figure:
The detection rate plotted against false positives as the detection
threshold is varied from -1 to 1, for two networks. The performance
was measured over all images from Test Sets A, B, and C. Network 1
uses two sets of the hidden units illustrated in
Figure 1, while Network 2 uses three sets. The
points labelled ``zero'' are the zero threshold points which are used
for all other experiments.
Table 1 shows the performance for four networks working alone, examines the effect of overlap elimination and collapsing multiple detections, and finally shows the results of using ANDing, ORing, voting, and neural network arbitration. Networks 3 and 4 are identical to Networks 1 and 2, respectively, except that the negative example images were presented in a different order during training. The results for ANDing and ORing networks were based on Networks 1 and 2, while voting and network arbitration were based on Networks 1, 2, and 3. The neural network arbitrators were trained using the images in Test Set A, so Test Set A cannot be used to evaluate the performance of these systems. Three different architectures for the network arbitrator were used. The first used 5 hidden units, as shown in Figure 8. The second used two hidden layers of 5 units each, with additional connections between the first hidden layer and the output. The last architecture was a simple perceptron.
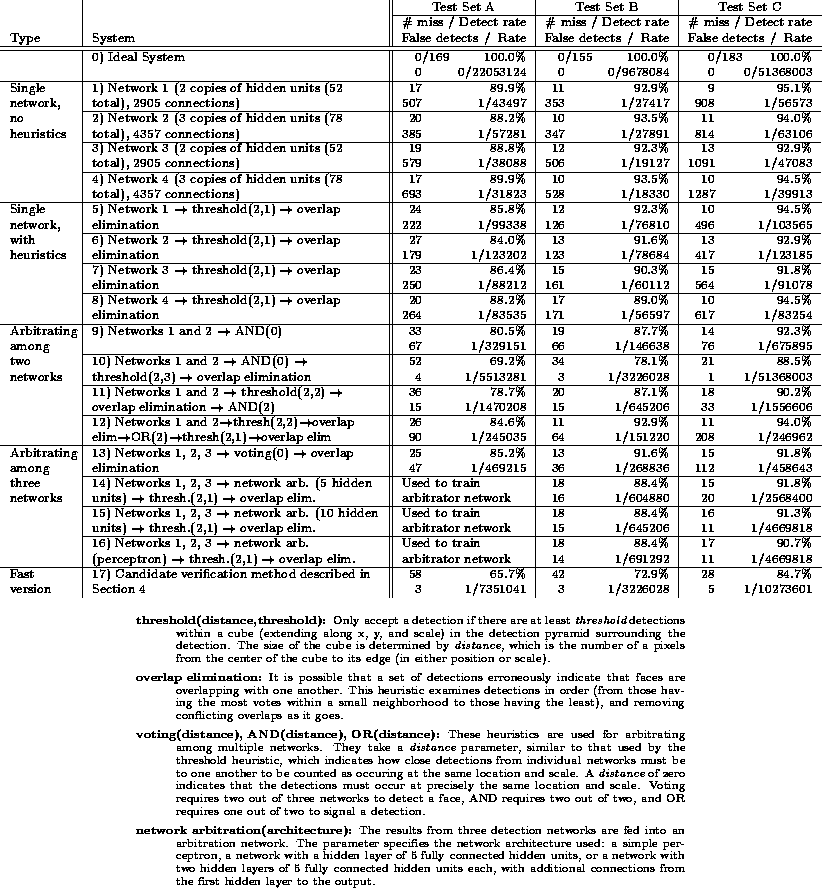
Table 1:
Detection and Error Rates for Test Sets A, B, and C
As discussed earlier, the ``thresholding'' heuristic for merging detections requires two parameters, which specify the size of the neighborhood used in searching for nearby detections, and the threshold on the number of detections that must be found in that neighborhood. In Table 1, these two parameters are shown in parentheses after the word ``threshold''. Similarly, the ANDing, ORing, and voting arbitration methods have a parameter specifying how close two detections (or detection centroids) must be in order to be counted as identical.
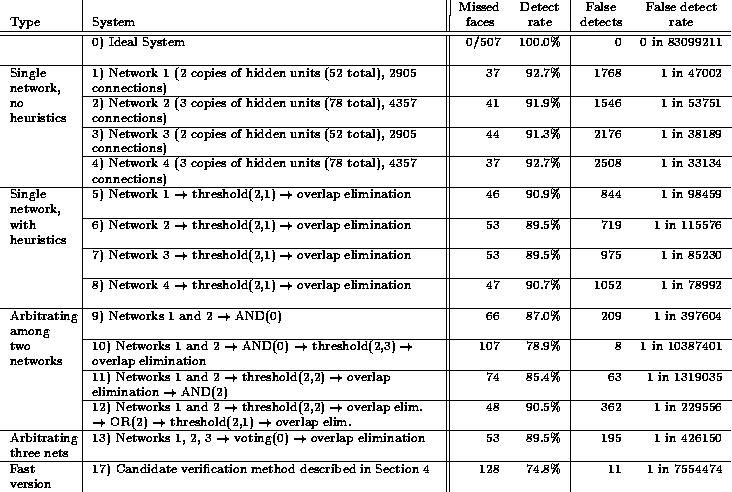
Table 2:
Combined Detection and Error Rates for Test Sets A, B, and C
As can be seen from Table 1, each system has better false positive rates on Test Sets A and C than on Test Set B, while Test Set C yields the highest detection rate and Test Set A the lowest. This is because of differences in the types of images in the three sets. To summarize the performance of each system, we combined all three test sets, and produced the summary statistics shown in Table 2. Note that because Systems 14, 15, and 16 use a neural network arbitrator which was trained using Test Set A, we cannot provide summary data for these systems.
Systems 1 through 4 show the raw performance of the networks. Systems 5 through 8 use the same networks, but include the thresholding and overlap elimination steps which decrease the number of false detections significantly, at the expense of a small decrease in the detection rate. The remaining systems all use arbitration among multiple networks. Using arbitration further reduces the false positive rate, and in some cases increases the detection rate slightly. Note that for systems using arbitration, the ratio of false detections to windows examined is extremely low, ranging from 1 false detection per 229,556 windows to down to 1 in 10,387,401, depending on the type of arbitration used. Systems 10, 11, and 12 show that the detector can be tuned to make it more or less conservative. System 10, which uses ANDing, gives an extremely small number of false positives, and has a detection rate of about 78.9%. On the other hand, System 12, which is based on ORing, has a higher detection rate of 90.5% but also has a larger number of false detections. System 11 provides a compromise between the two. The differences in performance of these systems can be understood by considering the arbitration strategy. When using ANDing, a false detection made by only one network is suppressed, leading to a lower false positive rate. On the other hand, when ORing is used, faces detected correctly by only one network will be preserved, improving the detection rate.
Systems 14, 15, and 16, all of which use neural network-based arbitration among three networks, yield about the same performance as System 11 on Test Set B. On Test Set C, the neural network-based arbitrators give a much lower false detection rate. System 13, which uses voting among three networks, yields about the same detection rate and lower false positive rate than System 12, which uses ORing of two networks. System 17 will be described in the next section.
Based on the results shown in Table 1, we concluded
that both Systems 11 and 15 make acceptable tradeoffs between the
number of false detections and the detection rate. Because System 11
is less complex than System 15 (using only two networks rather than a
total of four), we present results for it in more detail. System 11
detects on average 85.4% of the faces, with an average of one false
detection per 1,319,035 20x20 pixel windows examined.
Figures 11, 12, and 13 show example
output images from System 11![]() .
.
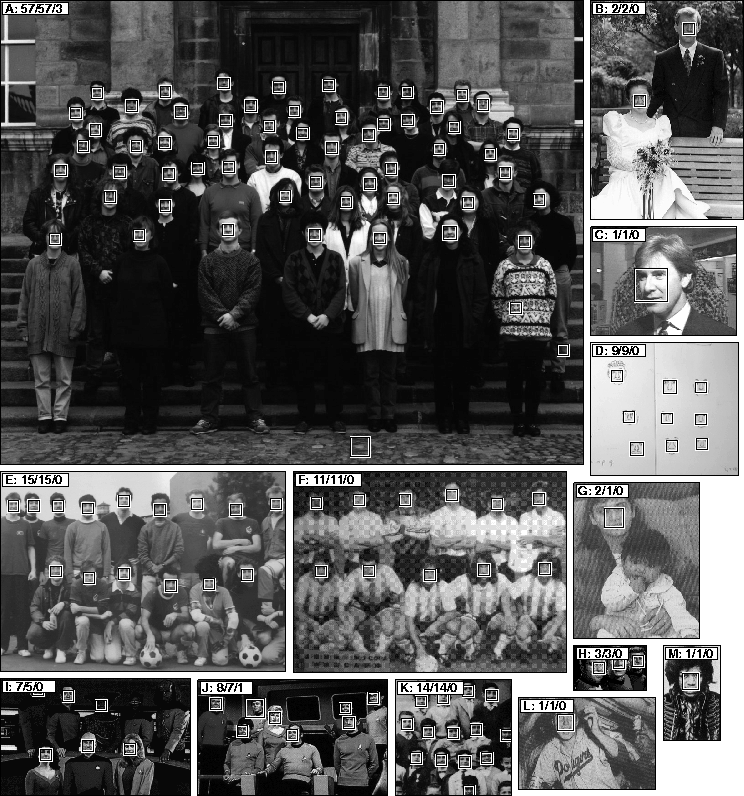
Figure:
Output obtained from System 11 in Table 1.
For each image, three numbers are shown: the number of faces in the
image, the number of faces detected correctly, and the number of false
detections. Some notes on specific images:
detections are present in A and J. Faces are missed in G
(babies with fingers in their mouths are not well represented in the
training set), I (one because of the lighting, causing one side of the
face to contain no information, and one because of the bright band
over the eyes), and J (removed because a false detect overlapped it).
Although the system was trained only on real faces, hand drawn faces
are detected in D. Images A, I, and K were obtained from the World
Wide Web, B was scanned from a photograph, C is a digitized television
image, D, E, F, H, and J were provided by Sung and Poggio at MIT, G
and L were scanned from newspapers, and M was scanned from a printed
photograph.
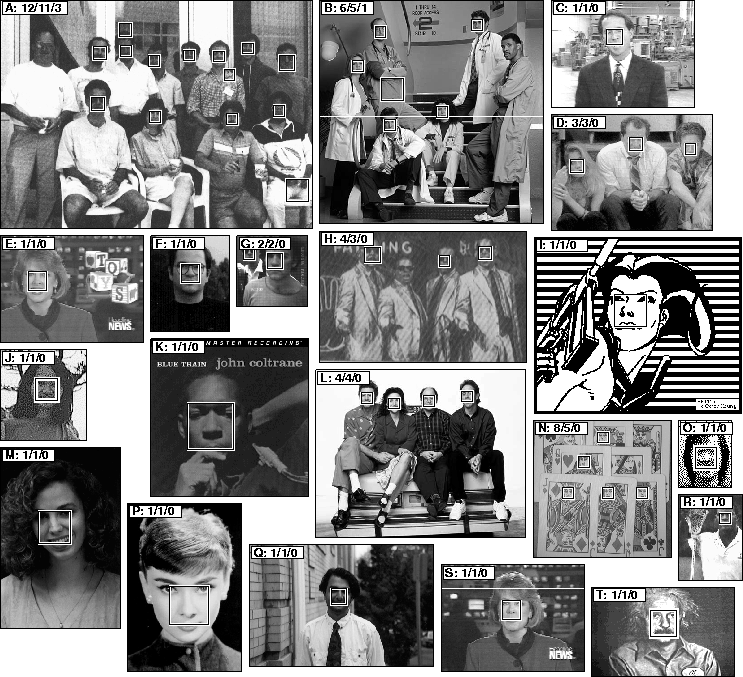
Figure:
Output obtained in the same manner as the examples in
Figure 11. Some notes on specific images:
are missed in A and H (for unknown reasons), B (large angle),
and N (the stylized faces are not reliably detected at the same
locations and scales by the two networks, and so are lost by the AND
heuristic). False detections are present in A and B. Although the
system was trained only on real faces, hand drawn faces are detected
in I and N. Images A, H, K, and R were scanned from printed
photographs, B, D, G, I, L, and P were obtained from the World Wide
Web, C, E, and S are digitized television images, F, J, M, and Q were
scanned from photographs, N and T were provided by Sung and Poggio at
MIT, and O is a dithered CCD image. Image M corresponds to
Figure 3A.
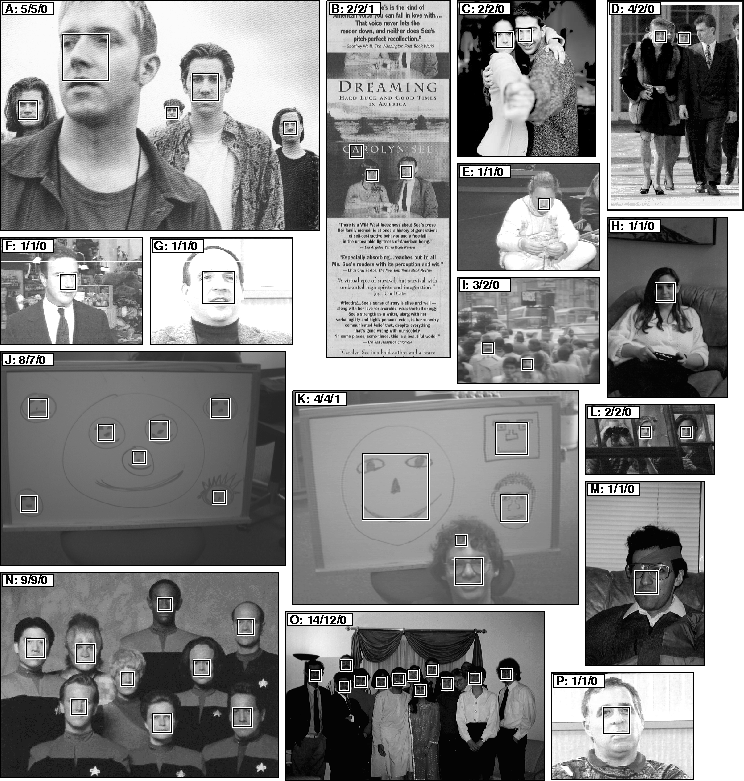
Figure:
Output obtained in the same manner as the examples in
Figure 11. Some notes on specific images:
are missed in D (one due to occlusion, one due to large angle),
I (for unknown reasons), J (the large middle face is recursive, with
smaller faces representing its eyes and nose; overlap elimination
would remove this face, but neither of the individual networks
detected it, possibly because the ``eyes'' are not dark enough), and O
(one due to occlusion, one due to large angle). False detections are
present in B and K. Although the system was trained only on real
faces, hand drawn faces are detected in J and K. Image A was scanned
from a printed photograph, B was scanned from a newspaper, C, L, and N
were obtained from the World Wide Web, D was provided by Sung and
Poggio at MIT, E, F, G, I, and P are digitized television images, H,
M, and O were scanned from photographs, and J and K are CCD images.
Image D corresponds to Figure 3B.