Back to "Biological Language Modeling Seminar Topics"
Back to "Protein structure prediction"
Mapping between Sequence - structure - function using Measures of similarity
Assessment: Wilson, Kreychman, Gerstein (2000) using 30,000 SCOP pairs
1. Mapping sequence to structure
1A. RMSD and percent identity

Figure from Wilson, Kreychman, Gerstein
(2000): RMS as a function
of percent identity. (a) A simple scatter plot of RMS separation to percent
sequence identity in SCOP pairs. Outliers (pairs with RMS scores further than
two standard deviations from the mean for their percent identity) are excluded
from this graph; they represent domains that are very closely related with the
exception of a conformational change. (b) A simplified graph with a number of
fits to the data. For each percent identity bin we show the median RMS value,
indicated by (![]() )
and the top and bottom quartile RMS values, indicated by the bars. Two fits are
drawn through the median RMS values. The thin line, labeled SINGLE, is a simple
exponential fit through the medians. The thick line, labeled MULTI, is a
multigraph fit.
)
and the top and bottom quartile RMS values, indicated by the bars. Two fits are
drawn through the median RMS values. The thin line, labeled SINGLE, is a simple
exponential fit through the medians. The thick line, labeled MULTI, is a
multigraph fit.
The twilight zone of sequence identity and below is labeled TZ. In this region, sequence similarity is not significant and not reliable for predicting structural similarity. This is why the median values in this area of the graph deviate significantly from the fits, which consider only data above 20% sequence identity. For reference we include the original data points from Chothia and Lesk's, 1986 paper (A.M. Lesk, personal communication), indicated by X.
The difference between the Chothia & Lesk trend and our relationship is
due to the different trimming methods used in calculating the RMS score. Chothia
and Lesk imposed a 3 Å cut-off in determining the conserved core residues; we
defined the core as the better matching (in terms of C![]() distances) half (50%) of the residue pairs. (c) and (d) The effect our trimming
has on median RMS values. The RMS values in (c) are calculated from all the
matched residues in each pair; the values in (d) are calculated from the better
matching 50% of the residues.
distances) half (50%) of the residue pairs. (c) and (d) The effect our trimming
has on median RMS values. The RMS values in (c) are calculated from all the
matched residues in each pair; the values in (d) are calculated from the better
matching 50% of the residues.
two drawbacks of this method:
1. the dependence of RMS separation on trimming makes it not so useful (trimming is necessary because the small distances b etween well-matched alpha carbon atoms have less of an effect on the RMS than do the very large distances between poorly matched atoms)
2. percent identity misses out similarity (e.g. K and R)
1B. Smith Waterman score and structural comparison score
- For sequence alignments, an alignment score (the Smith-Waterman score) is defined as the sum of the similarity matrix values for th alignment, mminus the total gap penalty
- for structure alignments, use the structural comparison score (Levitt and Gerstein 1998)
Figure 3a in Wilson, Kreychman, Gerstein (2000)
drawback:
- heavy length dependence, i.e. two pairs of similar domains with equal percent sequence identities by different length can have drastically different scores
1C. P-values expressing significance of sequence and structure similarity
- overcomes the length-dependence

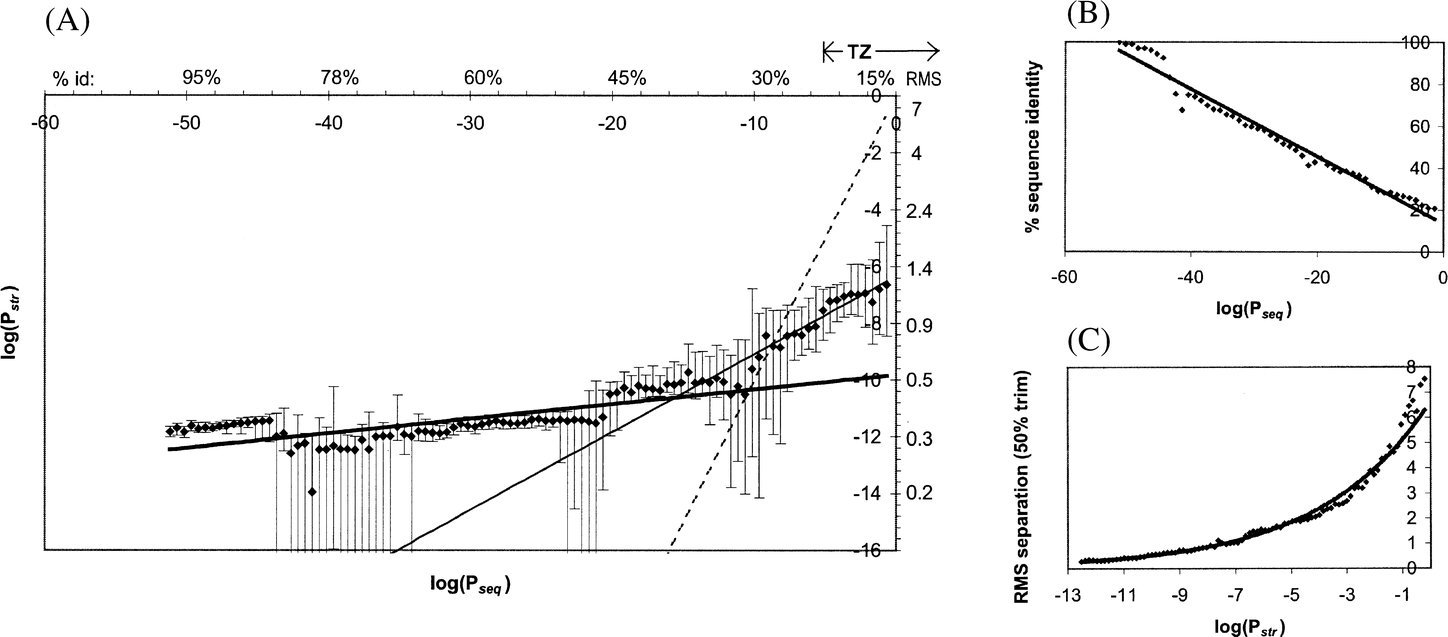
Figure from Wilson, Kreychman, Gerstein (2000): Probabilistic scores: P-values. Pseq and Pstr are P-values calculated from Sseq and Sstr according to the formalism given by Levitt & Gerstein (1998).
observations: 2 straight lines are needed to fit data
- In the twilight zone, structural similarity is more significant than sequence similarity (having a smaller P-=value or more negative log P-value)
- For highly homologous pairs (30% sequence identity), the situation is reversed, a given pair has more significant sequence similarity than structural similarity
==> for closely related sequences, differences in sequence similarity are more meaningful; for highly diverged sequences that share the same fold, the differences in structural similarity are more significant