CARNEGIE MELLON UNIVERSITY
15-826 - Multimedia databases and data mining
Spring 2007
[SOLUTIONS] Homework 2 - Due: Tuesday March 20, 1:30pm, in class.
For further questions or clarifications, please contact the TA.
Q1: String-edit and time-warping distances [40 pts]
This string editing distance code penalizes insertions, deletions and substitutions by 1 unit.
-
[15 pts] Modify it, so that the penalty for vowel-vowel substitution
is 0.5, and all other substitutions (consonant-consonant, vowel-consonant and consonant-vowel) should still have a penalty of '1'. Let the vowels be 'a',
'e', 'i', 'o', 'u'.
if (isVowel(val1) && isVowel(val2)){
	subcost = .5
} else {
	subcost = 1
}
-
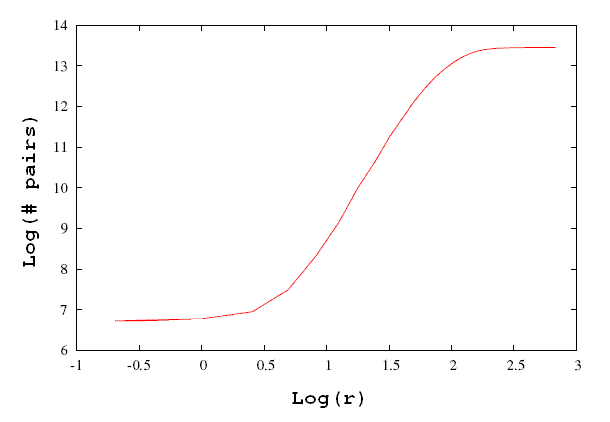
Using your modified string editing distance function, plot the correlation
integral for the a subset of the UNIX dictionary words
-
a) [4 pts] HAND IN the plot, and

-
b) [1 pt] report its slope.
Depending on which part of the plot you fit the line to, values could range from ~ 4.7 to 4.9.
-
[10 pts] Write code to calculate the time warping distance between two strings of numbers.
The rules of time-warping distance are fully described
in an ICDE 98 paper
(gzipped ps,
pdf).
In summary they are:
- Deletions are impossible (infinite cost)
- Stuttering of either time sequence is free. Specifically:
- Insertions in either time sequence are free, but you can only insert a value equal to the previous value (in other words, you may repeat any value as many times in a row as you like, for free)
- Substitutions cost the difference between the old and new value, ie: |x_old - x_new|
From page 18, algorithm 3 in ICDE paper (gzipped ps, pdf):

-
[5 pts] Using your time warping distance function, calculate and report the time warping distance between time_1.dat and time_2.dat.
797
-
[5 pts] Plot the original (un time-warped) time_1.dat and time_2.dat together in the same plot. In a separate plot, show both sequences together after alignment by time-warping.

Q2: Fractals [15 pts]
Download the fractal-dimension code
here and untar it.
Run it on the following datasets (points specified as x and y coordinate values):
For each dataset, hand in the following:
(a) the fractal dimensions of the dataset (both D0 and D2),
and
(b) the corresponding plots.
- [4 pt]
Elliptical galaxies (notice that the range of x is ~ [0, 40] while y is ~ [-1, 1]).
D0 = -1.40
D2 = 1.49

- [4 pt]
Spiral galaxies (notice that the range of x is ~ [0, 40] while y is ~ [-1, 1]).
D0 = -1.49
D2 = 1.47

- [4 pt]
Montgomery county.
D0 = -1.55
D2 = 1.70

- [3 pt]
"Mystery" dataset.
D0 = -.99
D2 = .97

Q3: Multi-Fractals [30 pts]
Using the b-model paper
(gzipped ps,
pdf )
as a guide:
-
[10 pts] Generate a dataset of 1,000,000 disk accesses distributed over 1,024 time intervals, according to a 30/70 (70% on the right) b-model. Submit a time plot (time stamp, number of disk accesses) of this dataset, along with both a soft and hard copy of the code used to generate the data.
Generate data according to figure 3 of b-model paper(gzipped ps, pdf:


Should look like:

-
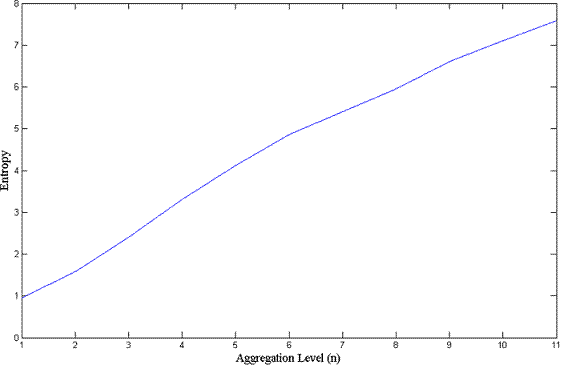
[10 pts] Implement a function to calculate the "entropy plot" of this dataset. Your code should zero-pad the sequence so that its length is brought up to the next power of 2. Hand this code in.
As per section 4.3 of b-model paper(gzipped ps, pdf:

-
[5 pts] Generate and hand in the entropy plot of the synthetic data you generated.

-
[5 pts] Generate and hand in the entropy plot of this real dataset of disk accesses over 2,048 lines/time intervals (each line contains the number of bytes transferred in that time interval).

Q4: Text and SQL[15 pts]
Download these five electronic books from the Project Guttenberg website. You will need to decompress them and remove the header text from the uncompressed files:
- Herman Melville's Moby Dick (document_id = 1)
- Leo Tolstoy's War and Peace (document_id = 2)
- Jane Austen's Pride and Prejudice (document_id = 3)
- Albert Einstein's Relativity: the Special and General Theory (document_id = 4)
- Laozi's Tao Te Ching (document_id = 5)
Given this data please:
-
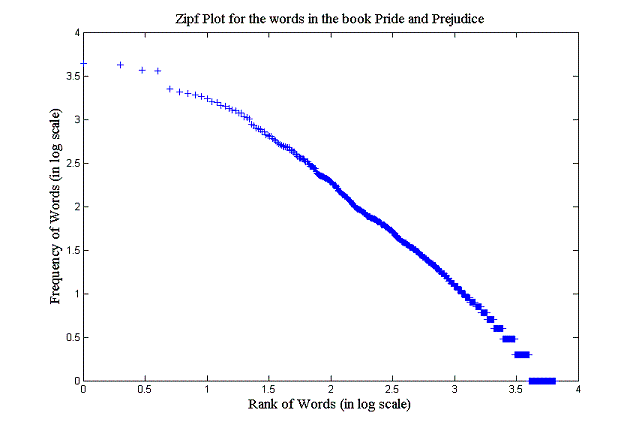
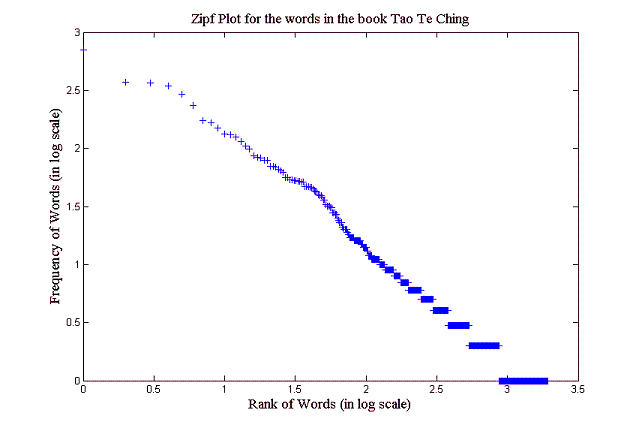
[5 pts] Generate and hand in the Zipf plots (rank-frequency, in log-log scale) for each of the texts. Also hand in the code used to generate these plots.
See section 2.1 of this paper for details:


-
[5 pts] Generate and hand in the probability density function (pdf) plots (count-frequency, in log-log scale) for each of the texts. Also hand in the code used to generate these plots.


-
[2 pts] Report which author has the largest vocabulary.
Leo Tolstoy
-
[1 pts] What else can these plots tell you about how each author uses his/her words?
Pretty much any answer showing thought will do,  Some interesting ideas were about
the sparse style of the Tao Te Ching due to cultural differences, or about
War and Peace due to translation.
-
[2 pts] Report which ten words are the most popular across all authors. Also report which ten words are most popular for each author.
| Author | word 1 | word 2 | word 3 | word 4 | word 5 | word 6 | word 7 | word 8 | word 9 | word 10 |
| All | the | of | and | to | a | in | that | he | it | his |
| Melville | the | of | and | a | to | in | that | his | it | i |
| Tolstoy | the | and | to | of | a | he | in | that | his | was |
| Austen | the | to | of | and | her | i | a | in | was | she |
| Einstein | the | of | to | a | in | is | and | we | this | that |
| Laozi | the | and | of | to | is | it | in | not | he | a |


 Should look like:


