Debug window
The Debug window enables you to debug your behavior by displaying messages coming from running behaviors.

Any message displayed includes:
- its level of severity,
- the path of the box concerned by the message and
- the text of the message.
Each message can have a different level of severity which are displayed with different prefixes and in different colours:
Level of
Severity
|
Prefix | Description |
|---|---|---|
| debug | 
|
This is generally used to debug a very specific point in the behavior. Note A message with a debug severity level also contains the corresponding line number in the box script which is in brackets and then the name of the concerned method in the box script. |
| verbose | 
|
These logs generally describe what is happening in the behavior step by step. |
| info | 
|
Generally these logs are not essential but can be useful for someone else who would use your behavior. |
| warning | 
|
This is generally used to warn you about an important fact which does not threaten the smooth running of the behavior. |
| error | 
|
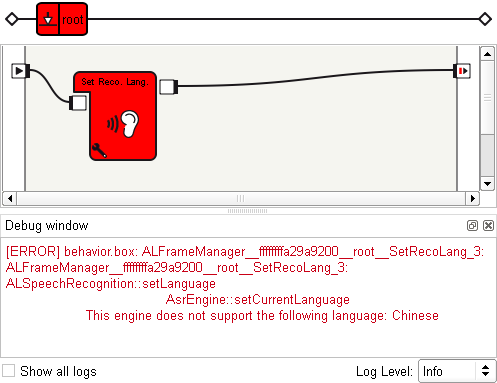
This is used for errors which does threaten the smooth running of the behavior. Note When an error is raised in a box, the specific box and all its parents get red in order to find the cause of the problem more easily. For example below, we tried to change the speech recognition language of NAO to Chinese but we did not have Chinese installed on the robot: 
|
| fatal | 
|
This is not very used but you can use it for example for errors which surely make the behavior crash. |
By default, this panel displays only messages caused by running behaviors with info as a minimal level of severity. But you can even get all messages from NAOqi and NAOqi’s modules, and get messages from lower level of severity. For further details, see the section about the functionalities of the Debug window.
The path of the box is contained in a string which look like the following: ALFrameManager__<behavior-id>__<box-path> where:
<behavior-id> corresponds to the identification number of the behavior (which enables you to determine which behavior does the message come from).
For example, on the screenshot above the table, you can see it was 8c423d8.
<box-path> corresponds to the path of the box which the message comes from.
For example if the message comes from a box named Child. This box is in the diagram of a box named Parent. Parent is in the main diagram. Then the path of Child should look like root__Parent_2__Child_4 for example.
The numbers in the path enables to identify boxes that have the same name so that the path is unique for each box.
See more about the available functionalities of this panel here.
Debug window
You can get all messages from NAOqi and NAOqi’s modules by checking the checkbox Show all logs.
You can also adjust the minimal level of severity by using Log Level drop-list.
For example, if Error is selected as Log Level, messages displayed in the panel will be only the ones defined as fatal or error. In the same way, if Debug is selected, messages of any level will be displayed.
Warning
Selecting a very low level will result in having a lot of messages, possibly reducing the speed of the whole application.
Note
You should know that you can send messages yourself from the scripts of your own boxes. For more information, see the section: Built-in functions in the script of a box.
If you right-click in the Debug window, the following menu will be displayed:

This context menu provides fast access to following functions:
- Copy: to copy the selected text block.
- Select All: to select the complete text block.
- Reset: to clear the debug panel.